Market Overview
Is market sentiment taking a turn for the worse again? If it is, then it looks like weak China data could once more be the catalyst. The disappointing readings on the China Manufacturing PMIs have again dampened sentiment that had so impressively bounced back in recent days. The official China PMI data was in line with expectations at 49.7 which the Caixin (a private survey) final PMI of 47.3 was actually slightly above the flash reading of 47.1 but more importantly confirms the disappointment of a 6 year low in the survey. A couple of weeks ago, the China PMIs had a significant impact across the markets and could the same happen again today? Already we are seeing the safer haven assets (yen, 10 year Treasuries and gold) all benefitting, whilst it is also interesting to see that oil has ticked lower and the euro has started to rally again. These are all trends seen in recent weeks that suggests market concerns with China.
Last night we saw Wall Street closing lower by around 0.9% on S&P 500, whilst Asian markets were weaker overnight (Nikkei down 3.8%). The European markets are also sharply lower at the open. The UK is playing catch up on some of yesterday’s losses too after the market was closed for a Bank Holiday yesterday.
It is incredible to see the volatility still trading through these forex majors as the markets again seem to be turning a corner. The US dollar is under the early pressure with euro, sterling and the yen all stronger. The Aussie dollar is barely changed after a slight deterioration in the current account and the decision by the Reserve Bank of Australia to stand pat on rates at 2.0% (as expected).
The first trading day of the month is PMI day and traders will be on the lookout for the Eurozone PMIs throughout the early morning. The UK PMI is at 0930BST and is expected to improve slightly to 52.0 (from 51.9 last month). The US ISM Manufacturing data is at 1500BST and is expected to tick slightly lower to 52.6 (from 52.7). There is also Canadian GDP released today at 1330BST which is expected to be +0.2% for the month and zero for the quarter.
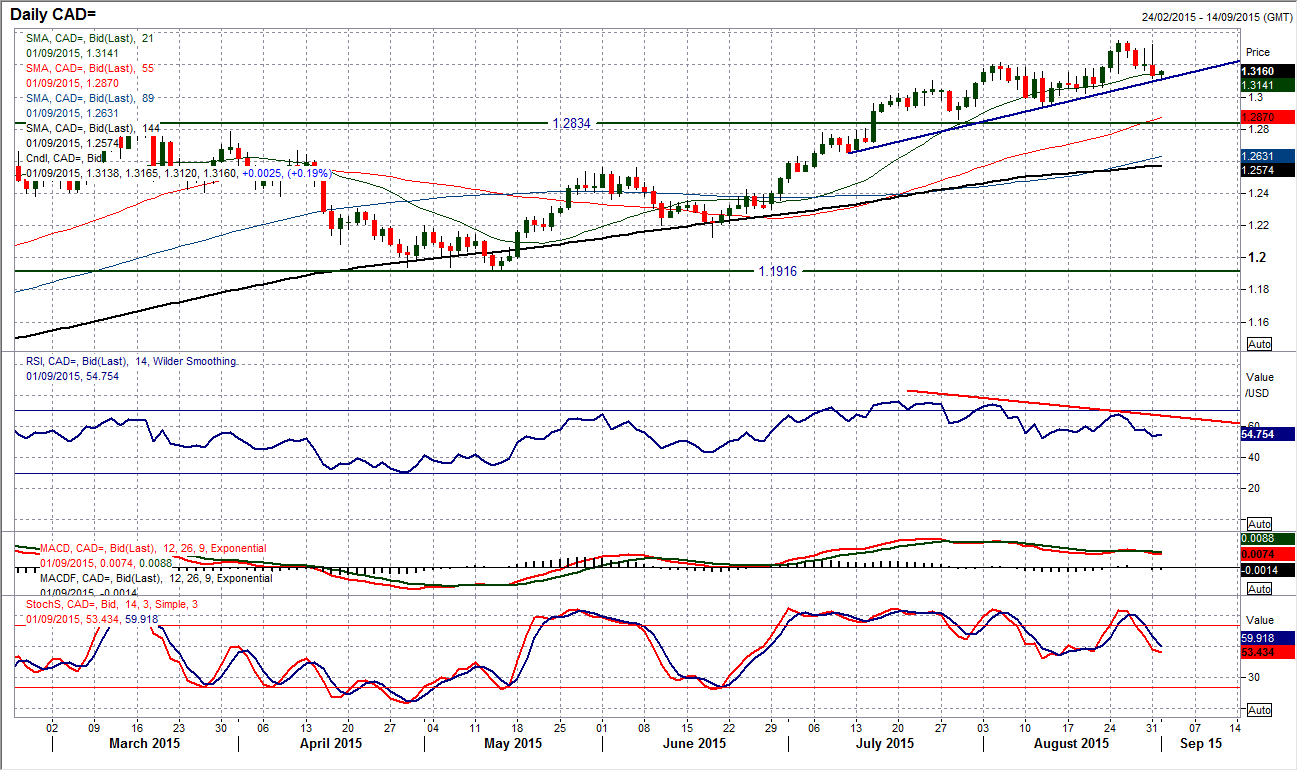
Chart of the Day – USD/CAD
The trend higher has come to an important crossroads now. The sharp rally on the price of oil has finally started to pull for a stronger Canadian dollar and this is now testing the consistent line of US dollar strength. A bearish outside day yesterday, with an initial move higher being completely reversed to close at a one week low shows the increasing strength of the Canadian dollar bulls. With the pair coming back once more to the support of the rising 21 day moving average (currently $1.3140), an uptrend dating back to early July is now under threat. It is interesting to note that the momentum indicators have been deteriorating for the last few weeks. Backed by a slightly corrective outlook on the MACD lines; a bearish divergence is showing on the RSI, and if it falls below 50 it would be taken as a real signal that the Canadian dollar is ready to strengthen again. The initial support comes in at $1.3020 before the key August low at $1.2950. Intraday resistance comes in at $1.2195/$1.3225, with $1.3325/$1.3350 now a key band of resistance.
EUR/USD
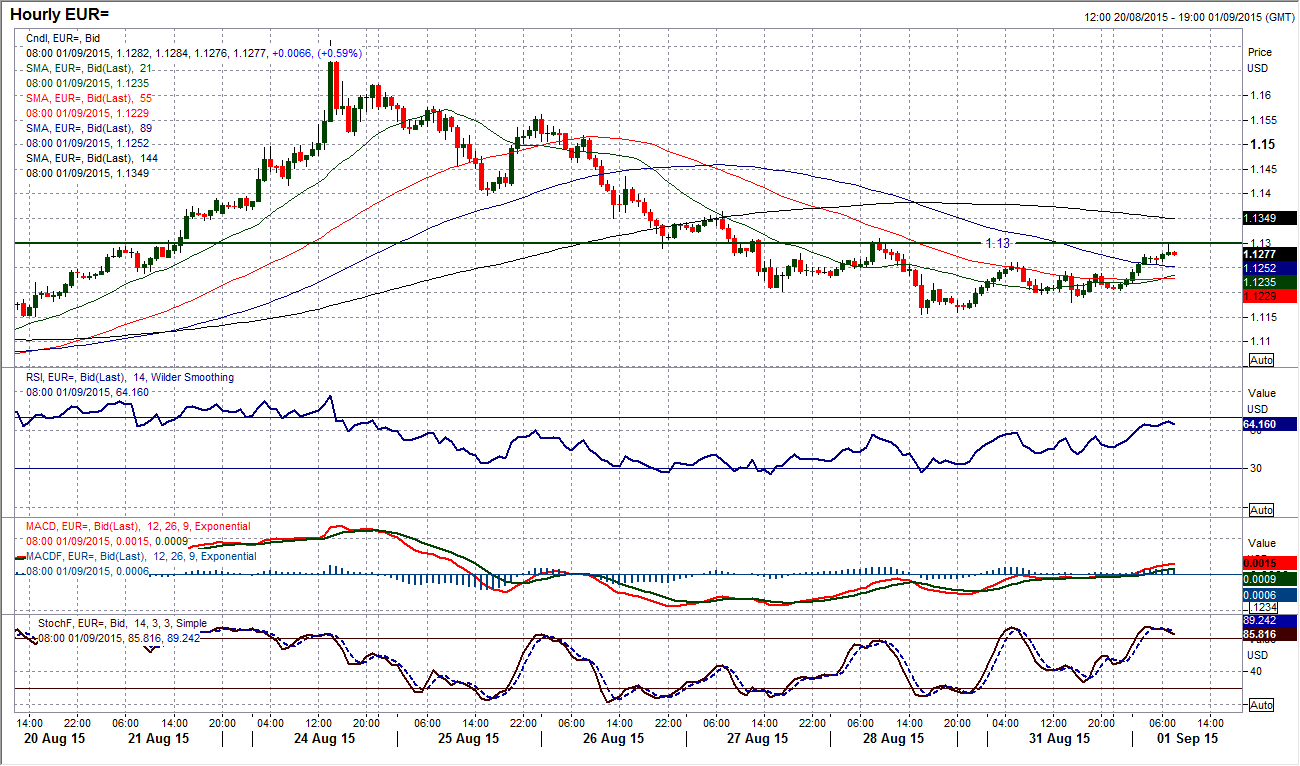
So the big unwinding correction on the euro that was seen throughout last week that pulled 550 pips lower has turned once again. The support has formed at a low of $1.1155 and started to move higher again as sentiment has again rounded a corner. Quite how sustainable the move is remains to be seen but the momentum indicators on the daily chart are bottoming and the choppy medium term outlook continues. The intraday hourly chart gives a bit more of an idea of an almost rounding base pattern as a near term consolidation forms. The resistance around $1.1300 which is a minor pivot within the sell-off and this is the first real lower high that would need to be overcome for this to be considered a recovery. The move would be confirmed on a break above a subsequent lower high at $1.1365. Near term support comes in around $1.1200, whilst Friday’s low at $1.1155 protects a retreat to the medium term pivot band $1.1050/$1.1100.
GBP/USD
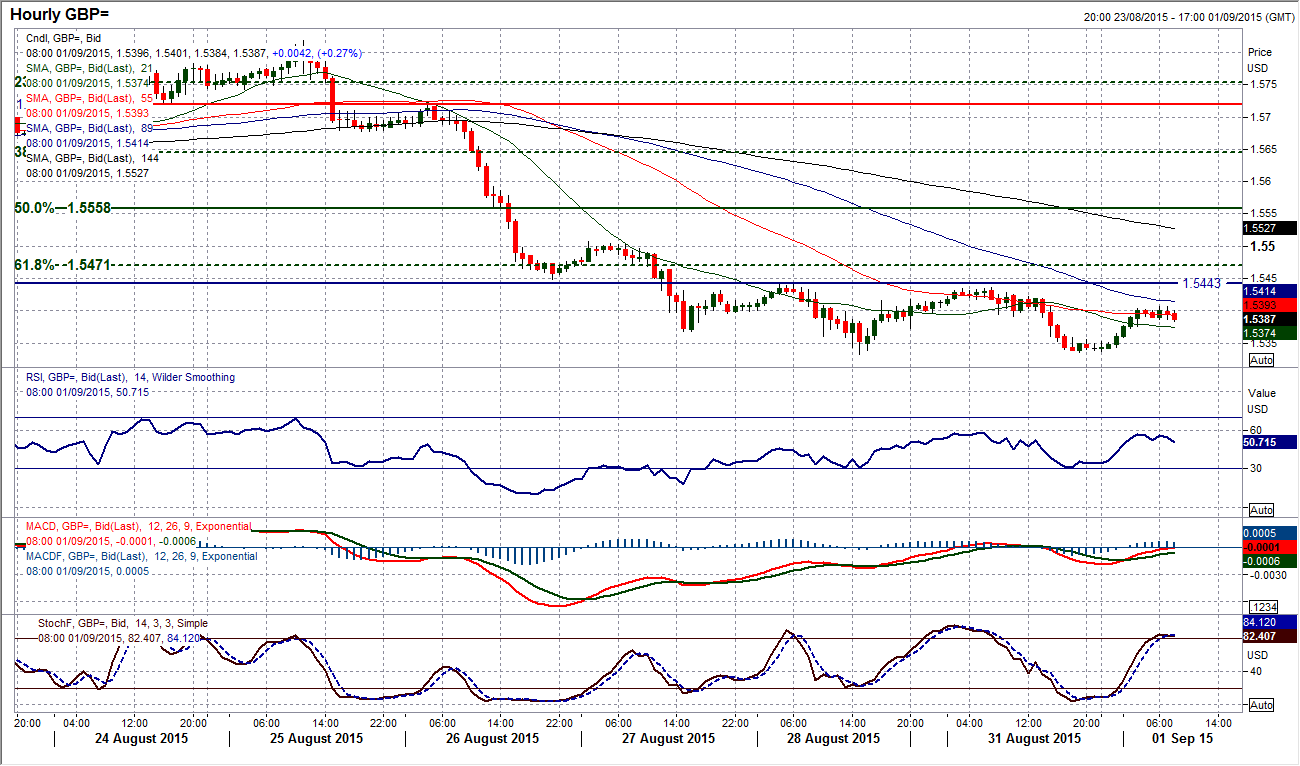
There are signs of support now after five days of consistent selling pressure. The support of the July low at $1.5328 has held in the past couple of days (Friday’s low being $1.5333) as a floor has started to form. This is beginning to see the momentum indicators bottom out, interestingly on a medium term basis this is happening around levels that would constitute a range play (RSI picking up from mid-30s for example). There is also more of a neutral near term outlook on the hourly chart with the consolidation and momentum indicators far more benign than they have been last week. For now this is merely a consolidation though and nothing positive would have been achieved without a move above the initial resistance band around $1.5445. This is a very difficult one to call as this consolidation has set in and perhaps it would be best to see which way the break happens.
USD/JPY
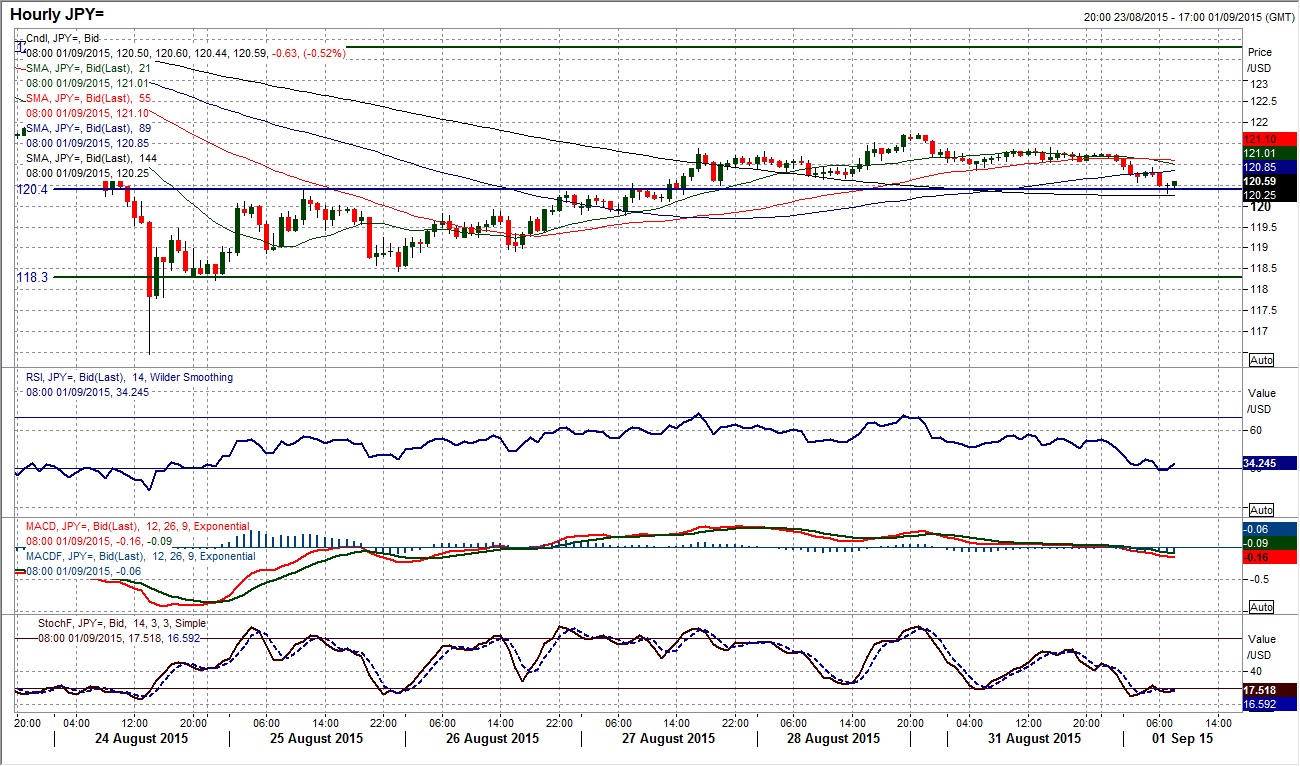
As with many of the charts I am looking at today there is a growing sense that the volatility that drove the strong move last week could be on the brink of another reversal. The four day rally on Dollar/Yen which had more than retraced 50% of the big 125.28/116.46 sell-off has now started to turn lower again. Yesterday saw a first bearish red candle posted for a week and already the momentum indicators are losing their upside impetus again. This is again indicative of the choppy moves we have seen in forex markets of the past couple of weeks and sentiment has been a strong indicator in that time. That would suggest when the pair turns a corner, it has done it with a decisive move. The intraday hourly chart shows that if the support at 120.50 is breached then the bears could gather momentum once more. Already we are seeing a more negative configuration building on the hourly RSI and MACD lines. Also remember the previous resistance of the range at 120.40 which also could now be supportive. This all comes after a lower high was posted at 121.40 under 121.75.
Gold
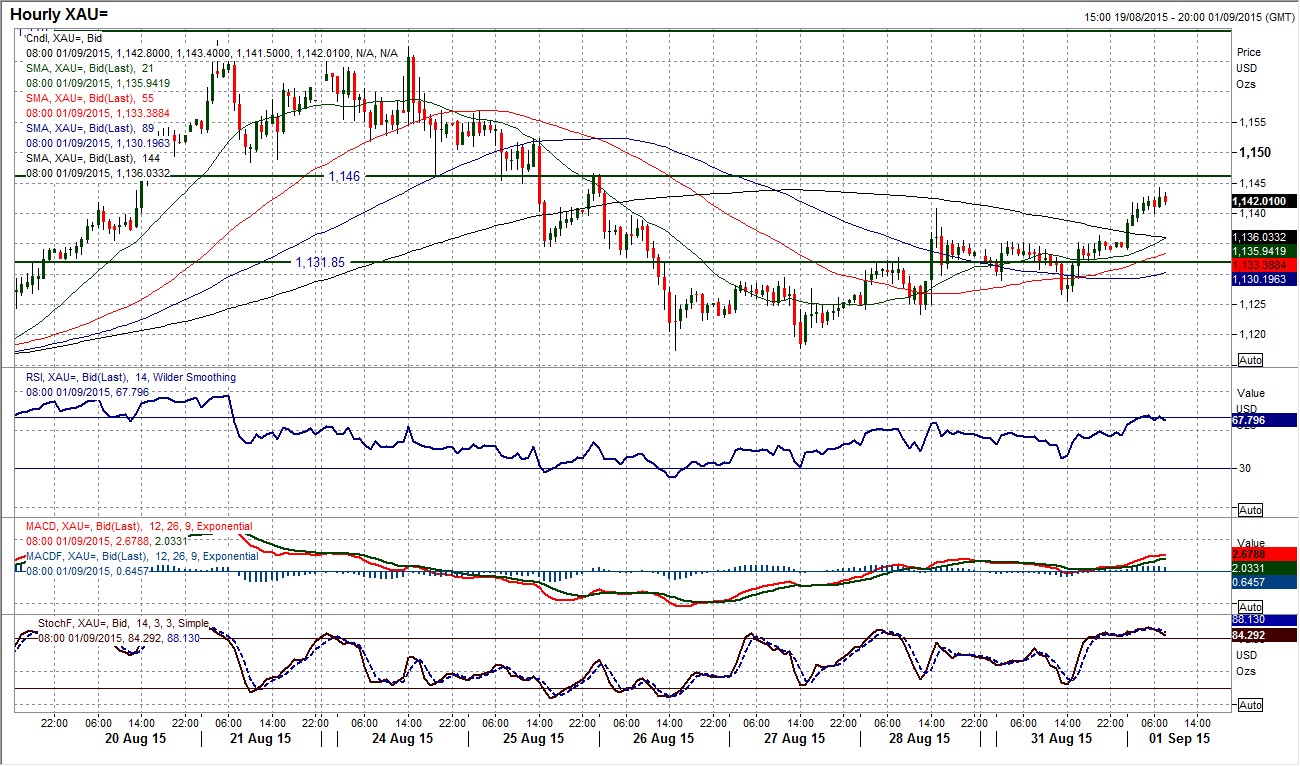
Perhaps the old price has been taking the lead in terms of market direction because the price had been supported before the end of last week and is now looking to push higher again. The support in at $1117.40 has been built upon and the bulls are starting to gain in confidence once more. A positive Asian session overnight will help this as the momentum indicators start to pick up again. However, it is the hourly chart which reflects the true improvement in the outlook, with a broken downtrend, slight higher lows and improving hourly momentum. On a near term basis now the intraday corrections are being bought into and this means that anything around $1135 is a chance to buy. The next resistance to be tested is at $1146 whilst $1152 is then the next level. A loss of the support at $1125.50 would now result in a deterioration once more.
WTI Oil
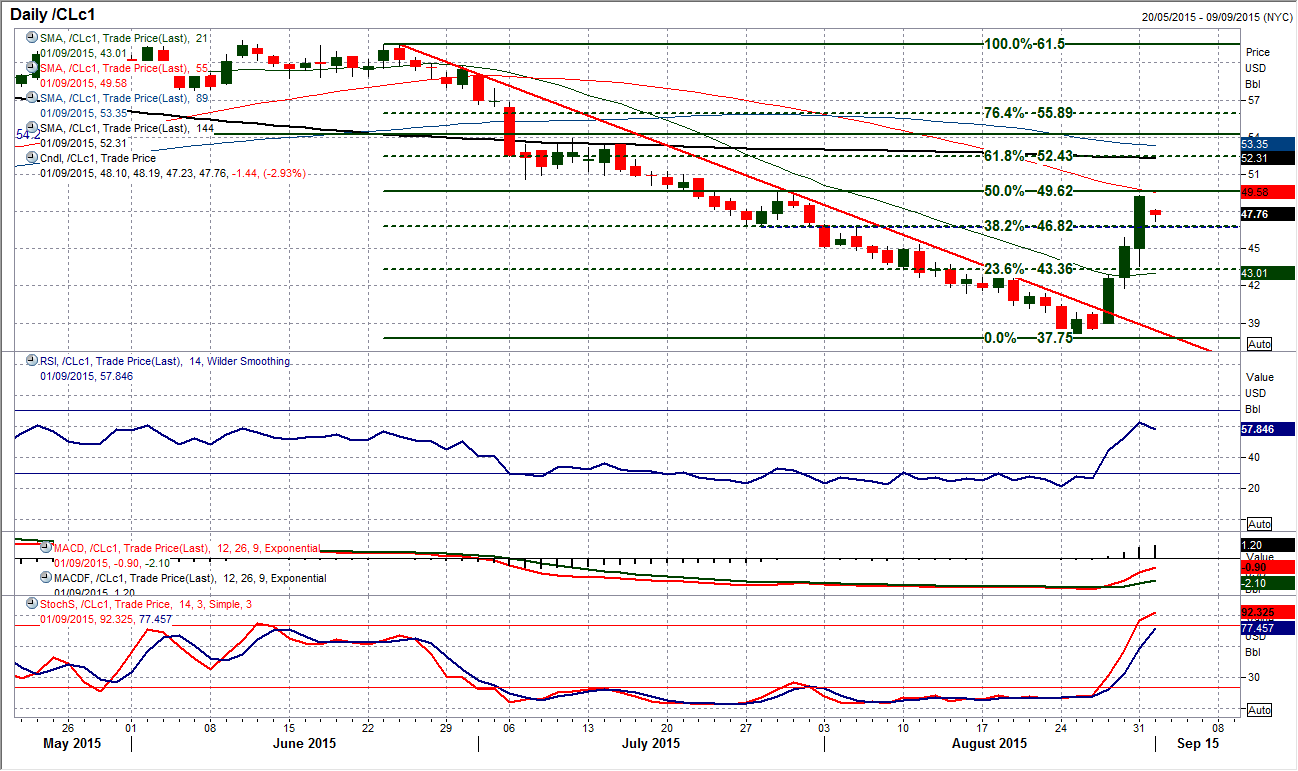
Can the absolutely incredible rally continue? The price bottomed at the beginning of last week at $37.75 and since then absolutely soared. WTI closed last night in US trading up almost 29% off the low. The last three days have posted three incredibly strong candles that suggest this is a rally is a force to be reckoned with. However, volatility is something that can see the price flying both ways currently and at this stage, with the price trading lower in early moves, I have to discuss potential turning points. It is that point at which the Fibonacci retracements are very interesting reference points. The rebound of the sell-off from $61.57 to $37.75 has already burst through 38.2% Fibonacci (at around $46.75 which becomes supportive) and the next upside level is the 50% retracement at around $49.65. This next potential consolidation point for WTI which also coincides with a band of resistance also between $49.50/$50.60. Momentum indicators are clearly increasingly strong, but there is further upside potential. The intraday hourly chart shows the initial support comes in a band between $43.60/$46.00.
Note: All information on this page is subject to change. The use of this website constitutes acceptance of our user agreement. Please read our privacy policy and legal disclaimer. Opinions expressed at FXstreet.com are those of the individual authors and do not necessarily represent the opinion of FXstreet.com or its management. Risk Disclosure: Trading foreign exchange on margin carries a high level of risk, and may not be suitable for all investors. The high degree of leverage can work against you as well as for you. Before deciding to invest in foreign exchange you should carefully consider your investment objectives, level of experience, and risk appetite. The possibility exists that you could sustain a loss of some or all of your initial investment and therefore you should not invest money that you cannot afford to lose. You should be aware of all the risks associated with foreign exchange trading, and seek advice from an independent financial advisor if you have any doubts.
Recommended Content
Editors’ Picks
EUR/USD holds firm above 1.0700 ahead of German inflation data

EUR/USD trades on a firm footing above 1.0700 early Monday. The pair stays underpinned by a softer US Dollar, courtesy of the USD/JPY sell-off and a risk-friendly market environment. Germany's inflation data is next in focus.
USD/JPY recovers after testing 155.00 on likely Japanese intervention

USD/JPY is recovering ground after crashing to 155.00 on what seemed like a Japanese FX intervention. The Yen tumbled in early trades amid news that Japan's PM lost 3 key seats in the by-election. Holiday-thinned trading exaggerates the USD/JPY price action.
Gold price bulls move to the sidelines as focus shifts to the crucial FOMC policy meeting

Gold price (XAU/USD) struggles to capitalize on its modest gains registered over the past two trading days and edges lower on the first day of a new week, albeit the downside remains cushioned.
Ripple CTO shares take on ETHgate controversy, XRP holders await SEC opposition brief filing

Ripple loses all gains from the past seven days, trading at $0.50 early on Monday. XRP holders have their eyes peeled for the Securities and Exchange Commission filing of opposition brief to Ripple’s motion to strike expert testimony.
Week ahead: FOMC and jobs data in sight

May kicks off with the Federal Open Market Committee meeting and will be one to watch, scheduled to make the airwaves on Wednesday. It’s pretty much a sealed deal for a no-change decision at this week’s meeting.
