Market Overview
After the “positivity” over the actions of the ECB last week, news from Greece over the weekend that the anti-austerity Syriza party has won the election has caused some Monday morning jitters on the financial markets. However the reaction to this news has not been as dramatic as it would have been a couple of years ago. With Asian markets fairly mixed, so far equity markets in Europe are only around 1% to 1.5% lower, whilst the euro remains weak anyway. With a general acceptance that the European banking system is far better capitalised now, this may reduced the bargaining power on the Greeks as and when they come to attempting to renegotiate on the debt of their €240bn loan. Furthermore, the price of gold which might have been considered to be a safe haven investing choice is currently slightly lower.
In forex trading, the euro is actually trading around the flat-line whilst cable is slightly higher. Although the major commodity currencies (CAD, AUD and NZD) are trading slightly negatively against the dollar today, we are still to see whether there will be a decisive reaction.
Traders will be watching out for the German Ifo Business Climate which is released today at 0900GMT which is forecast to improve for a third month in a row, from 105.5 to 106.7. This would help to provide support for the DAX and could also help to build a floor under the euro in the near term.
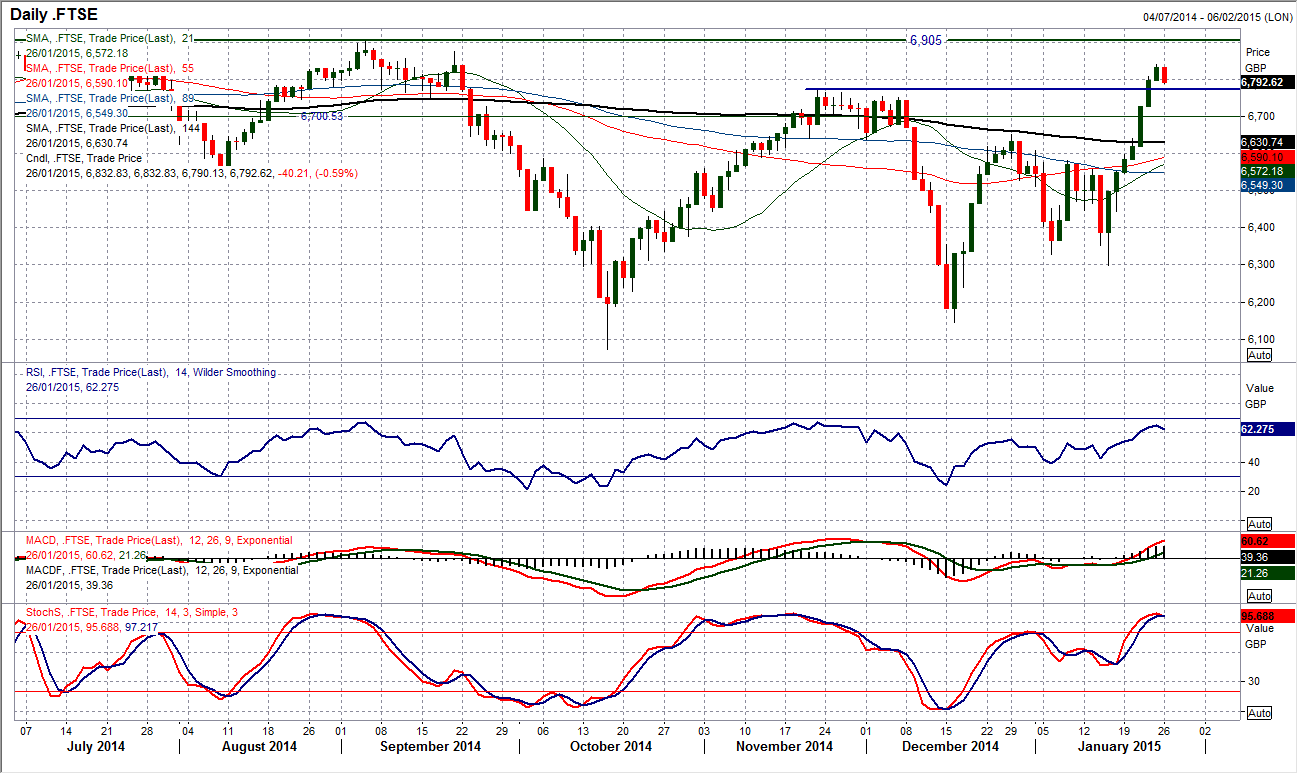
Chart of the Day – FTSE 100 Index
After 7 straight days of gains the FTSE 100 is under a little bit of pressure again today. The outlook has been significantly improved by the recent bull run however, it appears as though momentum can never quite be sustained to make a serious challenge on the key highs around 6900. The initial support around 6773 is being tested which is the top of a 120 point band of support which will need to hold in the coming days to prevent the good work of the bulls being broken down. It is interesting that the RSI on FTSE 100 can never quite be considered to be in strong configuration (ie. moving above 70), whilst the MACD lines and Stochastics are tentatively positive, also without being overly strong. Is this to once again be another false dawn for the FTSE 100 as the profit-takers once more move back in.
EUR/USD
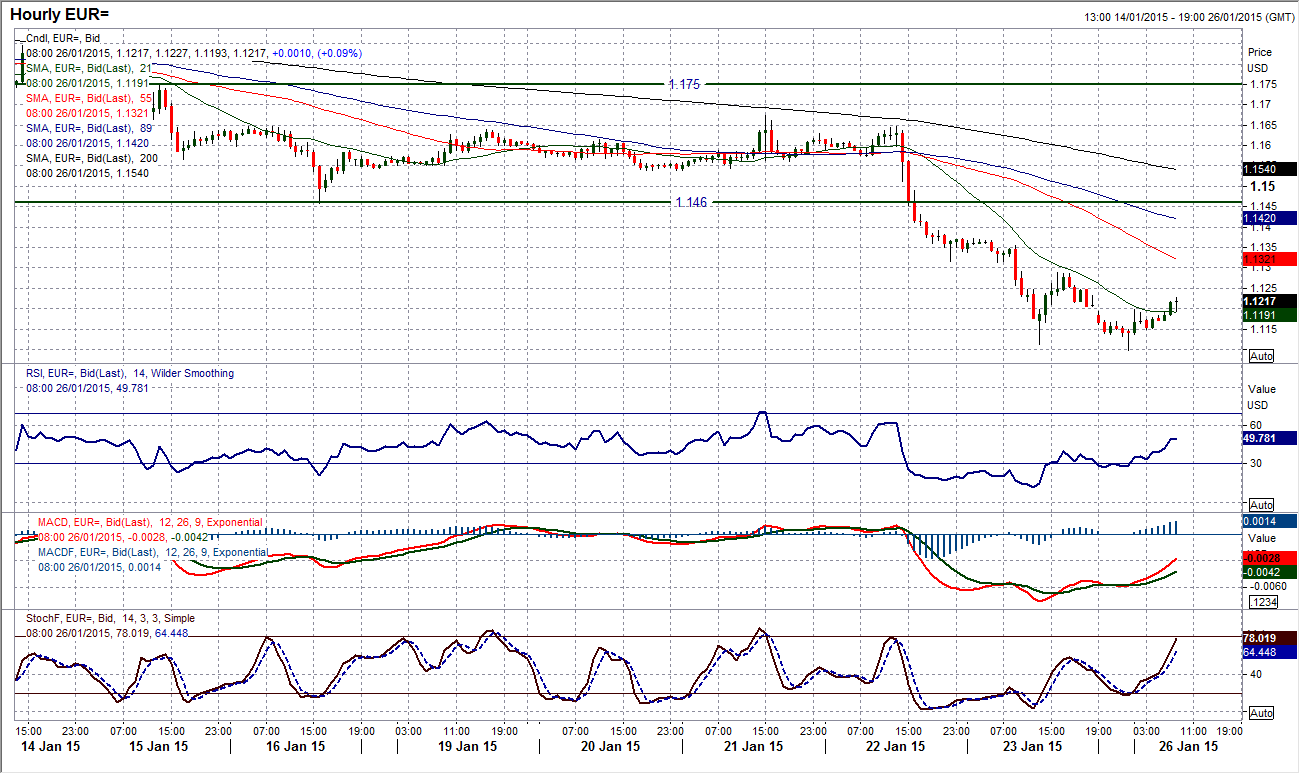
The euro remains under considerable pressure after the ECB further eased monetary policy on Thursday and the election victory for the Syriza party in Greece will only add to the bearish outlook for the common currency. However the immediate reaction early on Monday has not been all out selling. After an initial reaction lower on Sunday night (Asian trading hours for Monday) the euro has bounced around 100 pips off its low at $1.1098 (remember the long term 100% Fibonacci projection level I spoke about last week at $1.1093). The hourly technicals have shown an improvement with a bullish divergence present on the hourly RSI, MACD and Stochastics. We need to wait for the reaction from the European traders who could come in an smash the euro but for now the rate is holding up. The initial resistance is at $1.1288 which was a reaction high from an intraday rebound on Friday. It would need a breach of this near term ceiling to suggest that a potential technical rally may be building. For now though, with the bigger picture outlook still extremely bearish, we retain the likelihood that the overnight low at $1.1098 will be retested in due course.
GBP/USD
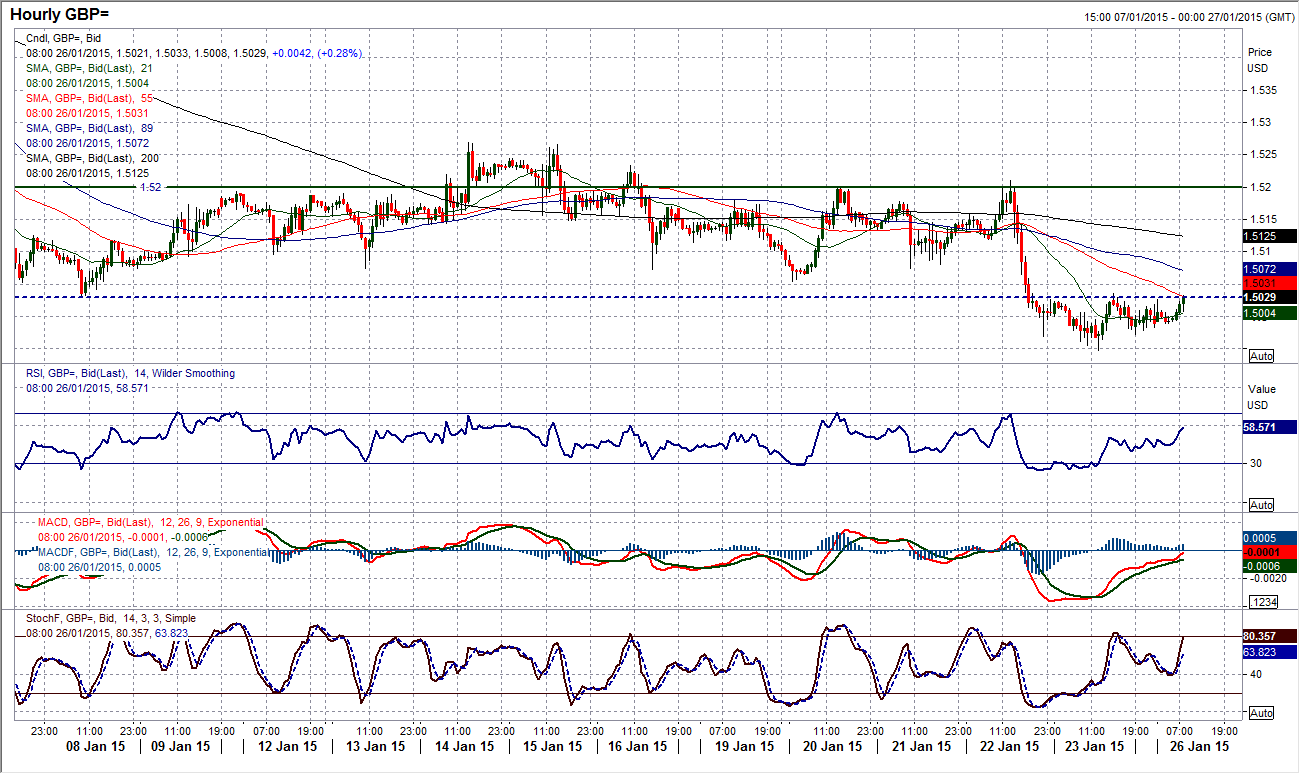
The outlook on the daily chart still looks concerning for sterling with all moving averages falling, downtrends intact and momentum indicators still bearishly configured. The prospect of further downside is likely in due course. The intraday hourly chart makes interesting reading though with the breakdown of the support of the old range around $1.5030 now providing the basis of resistance. This old support that has become new resistance is now a key element to the near term outlook, with the hourly RSI and MACD lines having unwound to neutral this should now become a good chance to sell the rally from $1.4948. However if the sterling bulls can make a concerted breach above $1.5030 then there is a possibility of a rebound taking hold. Up to the resistance of the old intraday floor around $1.5080 would then be seen as a band of overhead supply that the bulls may struggle to overcome before the sellers return once again.
USD/JPY
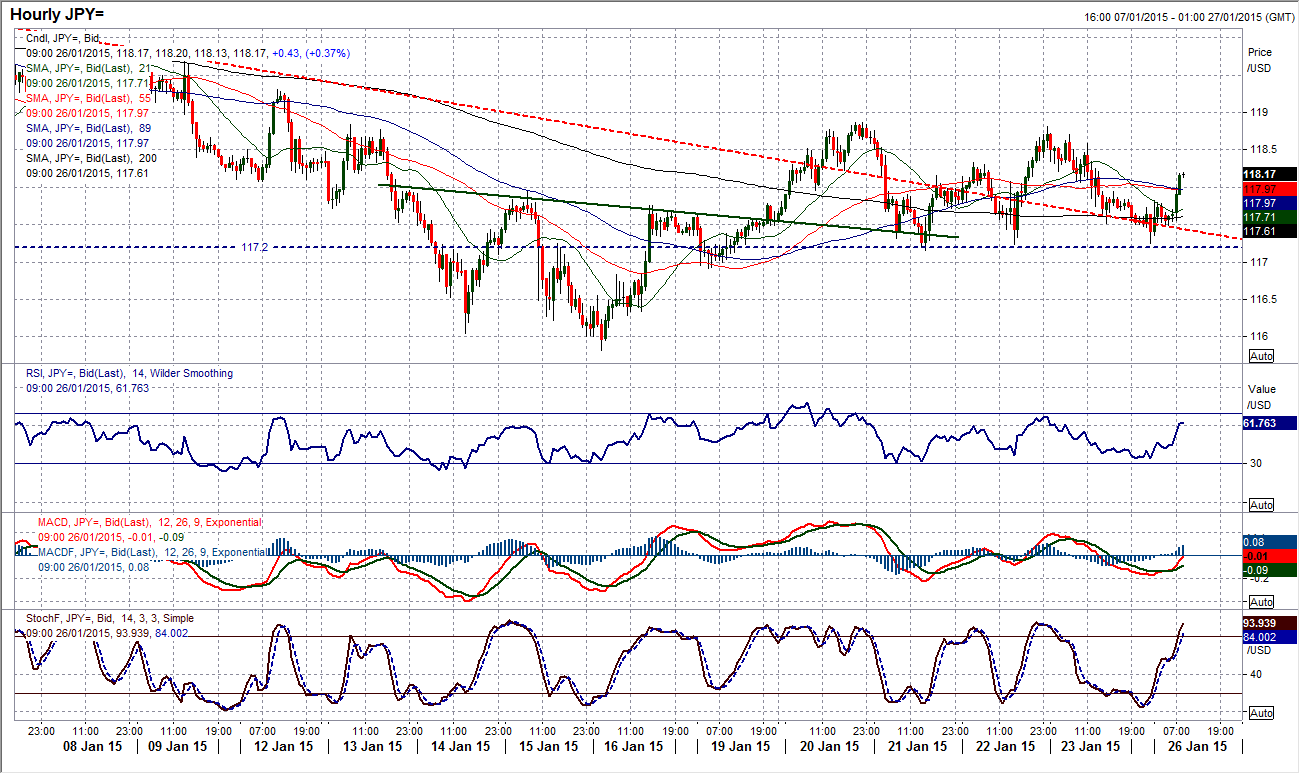
The daily chart shows an increasingly neutral medium term outlook which has seen the last five days trading in a 170 pip range (which is extremely tight considering the significant swings over the past few months). For several days I have been talking about the support around 117.20 which needs to hold for the recovery to remain on track and once again, overnight, this level has held firm. This means that we can still talk about the base pattern being intact and the potential for a rebound back above 119 which is a pivot level. Hourly momentum has improved in the past few hours with a MACD crossover and both RSI and Stochastics improving strongly. It will be interesting if the bulls can sustain the upside pressure early in the European session and maintain a move above 118. The hourly moving averages reflect an uncertain outlook near term and for now we must treat 119 as overhead supply, however I am still just erring on the side of the bulls, but only just.
Gold
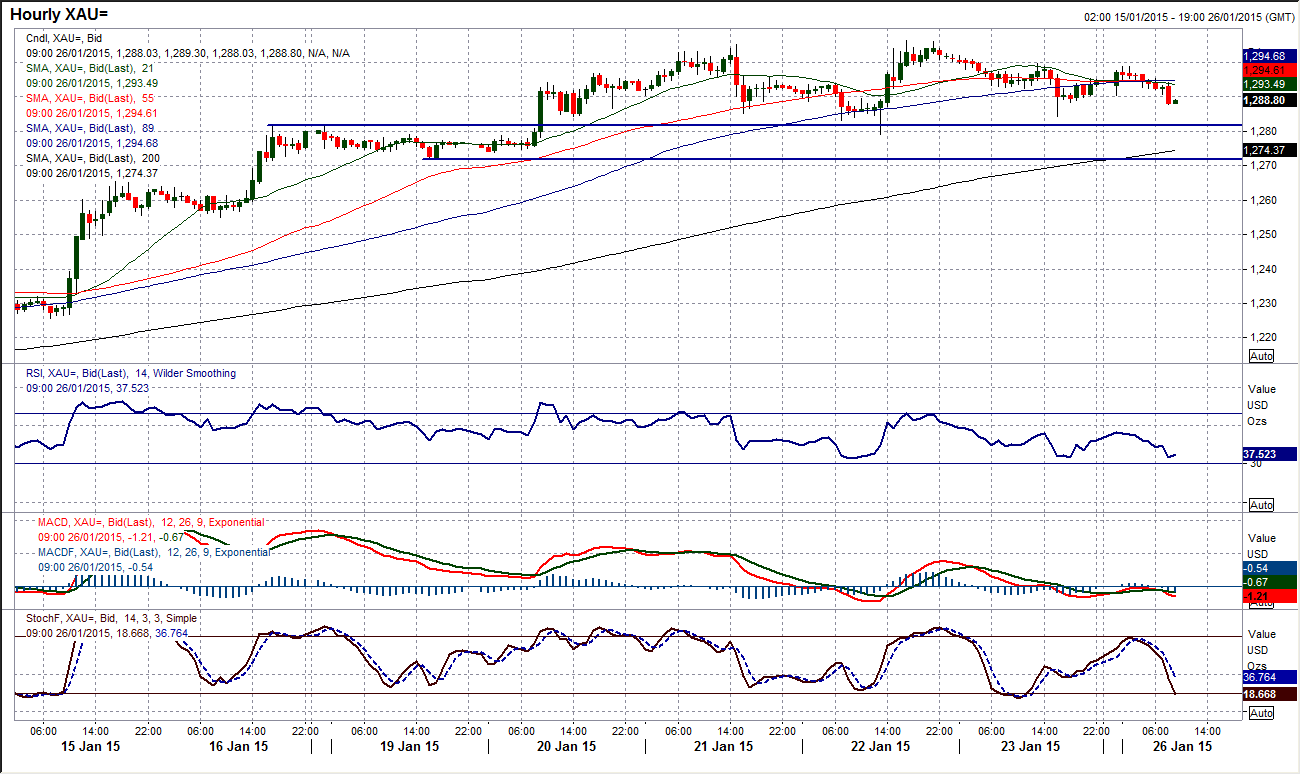
It is not often that you will see a bull run just go and go, and this one is beginning to be slightly questioned as a bout of consolidation has set in. The fact that this is coming with the RSI over 70 may just persuade some traders to start to take profits on what has been a tremendous run higher. To be fair though there is no significant sign of any real jitters. The intraday hourly chart shows a consolidation above the latest breakout, with support formed at $1279. Until we see a breach of the near term support at $1271.85 it is likely that the bulls are merely drawing breath after the strength of recent weeks. The hourly technical indicators do not show anything to be overly worried about yet either. I remain positive on gold for a test of $1322.60, the August high, in due course.
WTI Oil
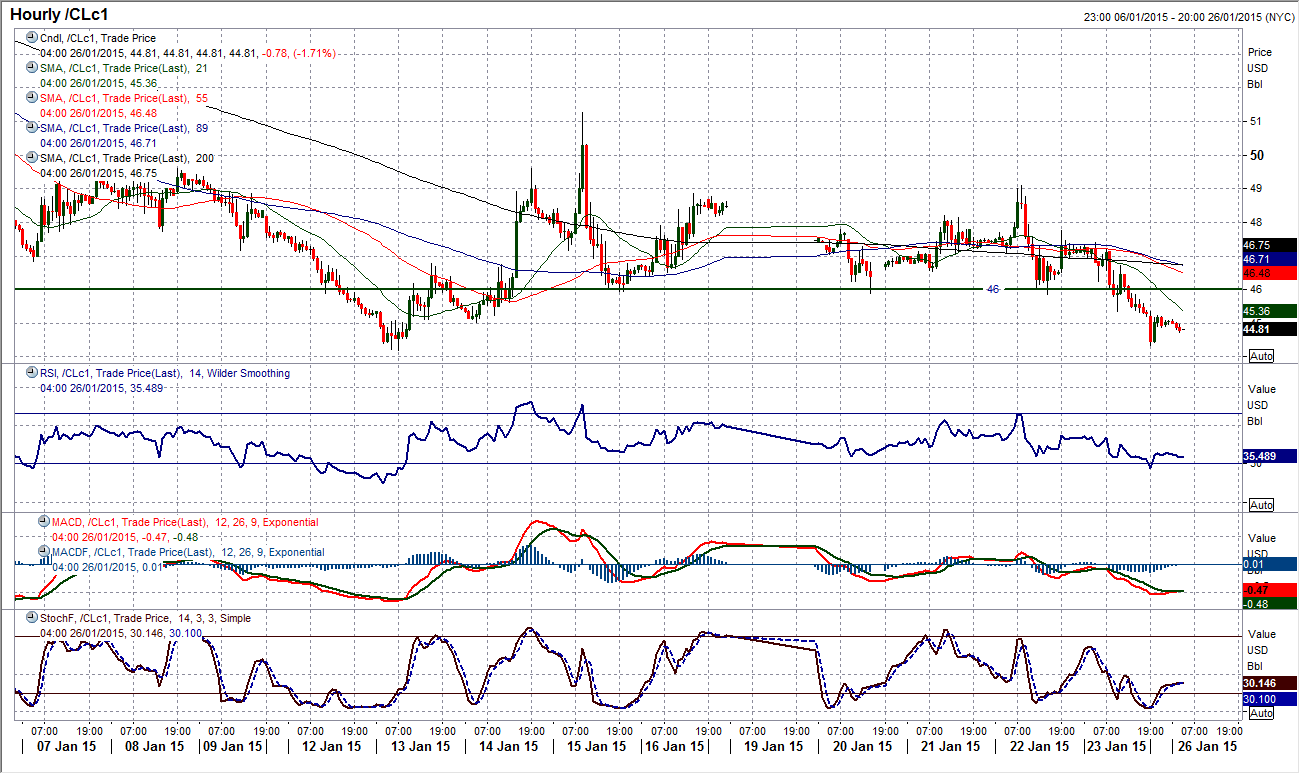
There was been a slightly concerning development in the WTI price in the past 12 hours as the price began to trade for the first time in a week below the support at $46 and subsequently to breach the $45 support as well. The intraday chart shows hourly moving averages beginning to drift lower and hourly momentum that is also just tailing off to the negative side. Furthermore after a sequence of positive and negative sessions there have now been two negative candlesticks in a row. With this coming as the old downtrend channel on the daily chart continues to provide overhead resistance (now at $48.90) and the 21 day moving average (currently $49.30 and also a basis of resistance) the sellers never seem to be too far away as the bearish influences on WTI are closing in. The bulls have really got a battle on their hands over the coming days otherwise the pressure on the key low at $44.20 could break support, which would then open $40. Resistance is now at $49.10 with $51.30 remaining key.
Note: All information on this page is subject to change. The use of this website constitutes acceptance of our user agreement. Please read our privacy policy and legal disclaimer. Opinions expressed at FXstreet.com are those of the individual authors and do not necessarily represent the opinion of FXstreet.com or its management. Risk Disclosure: Trading foreign exchange on margin carries a high level of risk, and may not be suitable for all investors. The high degree of leverage can work against you as well as for you. Before deciding to invest in foreign exchange you should carefully consider your investment objectives, level of experience, and risk appetite. The possibility exists that you could sustain a loss of some or all of your initial investment and therefore you should not invest money that you cannot afford to lose. You should be aware of all the risks associated with foreign exchange trading, and seek advice from an independent financial advisor if you have any doubts.
Recommended Content
Editors’ Picks
EUR/USD clings to gains above 1.0750 after US data

EUR/USD manages to hold in positive territory above 1.0750 despite retreating from the fresh multi-week high it set above 1.0800 earlier in the day. The US Dollar struggles to find demand following the weaker-than-expected NFP data.
GBP/USD declines below 1.2550 following NFP-inspired upsurge

GBP/USD struggles to preserve its bullish momentum and trades below 1.2550 in the American session. Earlier in the day, the disappointing April jobs report from the US triggered a USD selloff and allowed the pair to reach multi-week highs above 1.2600.
Gold struggles to hold above $2,300 despite falling US yields

Gold stays on the back foot below $2,300 in the American session on Friday. The benchmark 10-year US Treasury bond yield stays in negative territory below 4.6% after weak US data but the improving risk mood doesn't allow XAU/USD to gain traction.
Bitcoin Weekly Forecast: Should you buy BTC here? Premium

Bitcoin (BTC) price shows signs of a potential reversal but lacks confirmation, which has divided the investor community into two – those who are buying the dips and those who are expecting a further correction.
Week ahead – BoE and RBA decisions headline a calm week

Bank of England meets on Thursday, unlikely to signal rate cuts. Reserve Bank of Australia could maintain a higher-for-longer stance. Elsewhere, Bank of Japan releases summary of opinions.
