![]() LikesMoney
LikesMoney
Independent Analyst
The Dollar
Wednesday's swing low and break above the declining trend line confirms that the dollar has begun a new daily cycle.
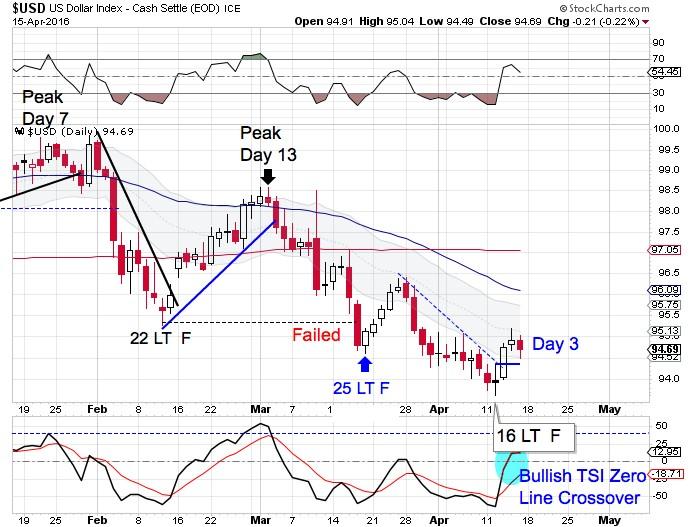
The dollar has been in a daily down trend as characterized by peaks below the upper daily cycle band and lows below the lower daily cycle band. The dollar will remain in a daily down trend until it can close above the upper daily cycle band.
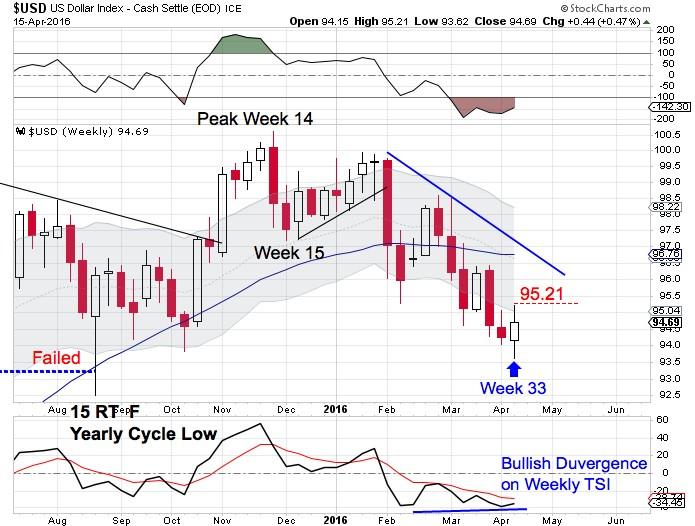
The dollar is deep in its timing band to print an intermediate cycle low. The bullish reversal that formed this week will likely mark the weekly cycle low. A break above 95.21 forms a weekly swing low. Then a break above the declining weekly trend line will confirm a new intermediate cycle.
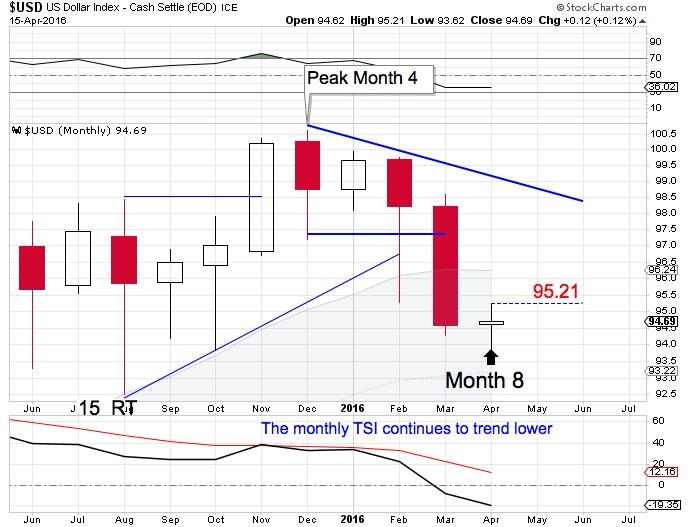
April is month 8 for the yearly dollar cycle. This places the dollar in its timing band to form a yearly cycle low. Since April printed a lower low, the earliest a monthly swing low can form is in May. Then a break above the declining monthly trend line will confirm that April hosted the yearly cycle low.
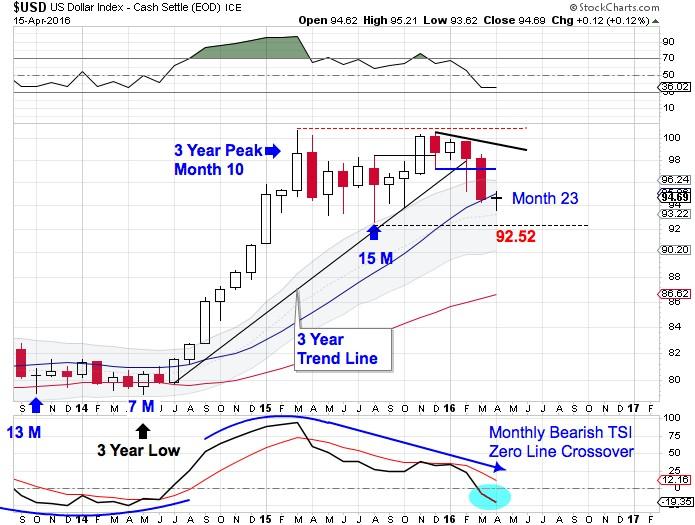
The 3 year cycle peaked back on month 10. April is month 23 for the 3 year dollar cycle. February’s break of the 3 year trend line indicates that the dollar has begun its 3 year cycle decline. A failed yearly cycle is required to complete the 3 year cycle decline. Currently a break below 92.52 will form a failed yearly cycle.
However if April forms a yearly cycle low, that will ease the parameters for forming a failed yearly cycle. If a new yearly cycle is confirmed, by a break above the declining monthly trend line, then a break below April’s low will form a failed yearly cycle. The dollar’s 3 year cycle averages about 36 months. So if April is the yearly cycle low, allowing 10 – 12 months would then bring the dollar to months 33 – 35, which is right in the timing band for a 3 year cycle low.
Stocks
Stocks formed a daily swing low on Tuesday and then closed convincingly above the declining trend line on Wednesday to confirm a new daily cycle.
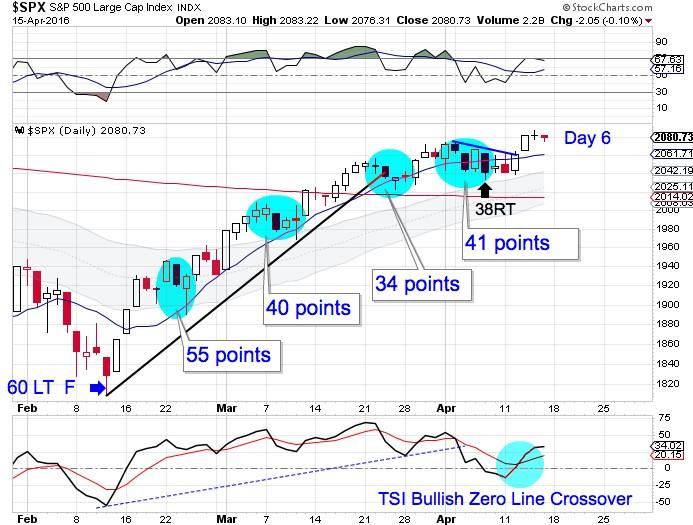
Stocks managed to stay above the upper daily cycle band during the decline into the daily cycle low indicating that stocks are in a daily uptrend. Stocks will remain in a daily uptrend until they close below the lower daily cycle band.
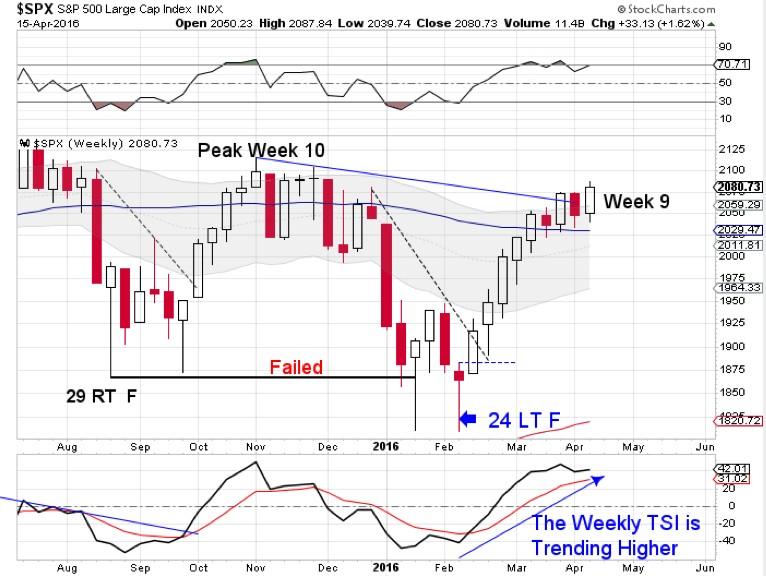
This is week 9 for the intermediate equity cycle. Stocks have broke above the declining weekly trend line and also closed above the upper weekly cycle band. This indicates that stocks are re-establishing a weekly uptrend and have left behind their yearly cycle low.

The yearly equity cycle peaked last May, which was month 7. Then stocks entered a period of volatility as they declined into their yearly cycle low. Stocks broke below the previous yearly cycle low on January, which confirmed the 7 year cycle decline. Then stocks printed a lower low in February. The swing low that formed in March signaled that February hosted the yearly cycle low. The break above the declining monthly trend line confirms that February was the yearly cycle low and indicates that stocks are also leaving behind their 7 year cycle low.
Note: All information on this page is subject to change. The use of this website constitutes acceptance of our user agreement. Please read our privacy policy and legal disclaimer. Opinions expressed at FXstreet.com are those of the individual authors and do not necessarily represent the opinion of FXstreet.com or its management. Risk Disclosure: Trading foreign exchange on margin carries a high level of risk, and may not be suitable for all investors. The high degree of leverage can work against you as well as for you. Before deciding to invest in foreign exchange you should carefully consider your investment objectives, level of experience, and risk appetite. The possibility exists that you could sustain a loss of some or all of your initial investment and therefore you should not invest money that you cannot afford to lose. You should be aware of all the risks associated with foreign exchange trading, and seek advice from an independent financial advisor if you have any doubts.
Recommended Content
Editors’ Picks
EUR/USD holds firm above 1.0700 ahead of German inflation data

EUR/USD trades on a firm footing above 1.0700 early Monday. The pair stays underpinned by a softer US Dollar, courtesy of the USD/JPY sell-off and a risk-friendly market environment. Germany's inflation data is next in focus.
USD/JPY recovers after testing 155.00 on likely Japanese intervention

USD/JPY is recovering ground after crashing to 155.00 on what seemed like a Japanese FX intervention. The Yen tumbled in early trades amid news that Japan's PM lost 3 key seats in the by-election. Holiday-thinned trading exaggerates the USD/JPY price action.
Gold price bulls move to the sidelines as focus shifts to the crucial FOMC policy meeting

Gold price (XAU/USD) struggles to capitalize on its modest gains registered over the past two trading days and edges lower on the first day of a new week, albeit the downside remains cushioned.
Ripple CTO shares take on ETHgate controversy, XRP holders await SEC opposition brief filing

Ripple loses all gains from the past seven days, trading at $0.50 early on Monday. XRP holders have their eyes peeled for the Securities and Exchange Commission filing of opposition brief to Ripple’s motion to strike expert testimony.
Week ahead: FOMC and jobs data in sight
May kicks off with the Federal Open Market Committee meeting and will be one to watch, scheduled to make the airwaves on Wednesday. It’s pretty much a sealed deal for a no-change decision at this week’s meeting.