Cycle Trading: Weekend Report Preview
The Dollar
The dollar's daily cycle peaked on day 8, formed a swing high and lost the 50 day MA to begin its daily cycle decline.
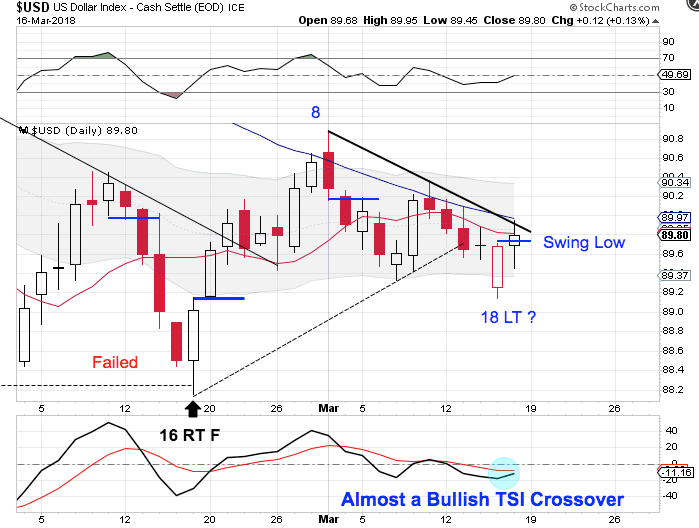
The dollar printed its lowest point on Thursday, day 18, placing the dollar in its timing band for a DCL. The dollar has formed a swing low. The dollar will need to confirm the new daily cycle. A break above the declining trend line will confirm the new daily cycle.
The peak on day 8 locks in a left translated daily cycle formation, which is consistent with an intermediate cycle decline. But if day 18 is confirmed as the DCL then the dollar would have printed a higher low, which helps to confirm that the dollar is in a new intermediate cycle. The dollar is facing triple resistance with the convergence of the declining trend line, and both the 10 day MA and the 50 day MA. Breaking above this triple resistance would provide further evidence that the dollar is in a new intermediate cycle.
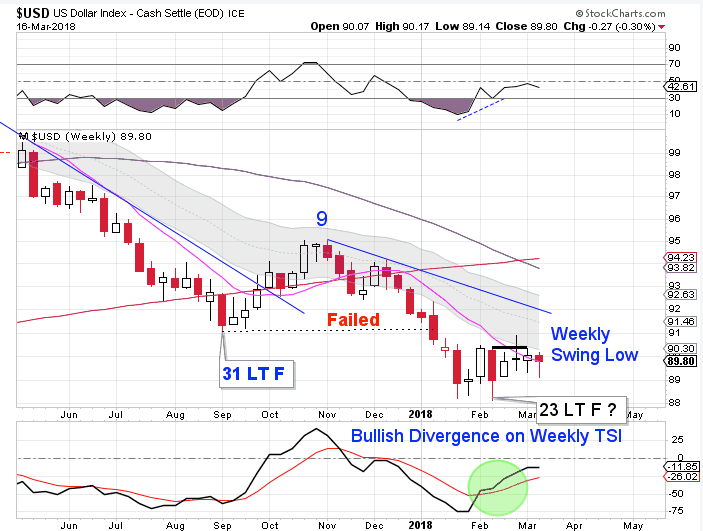
The dollar printed its lowest point on week 23, following the week 9 peak. That places the dollar in its timing band for an intermediate cycle low. As we discussed above, the daily chart is beginning to show signs of a new intermediate cycle. The dollar need to close above the 10 week MA and turn it higher for confirmation of the new intermediate cycle. The dollar should also break above the declining trend line. The dollar is in a weekly downtrend & will remain so unless it closes above it the upper weekly cycle band.
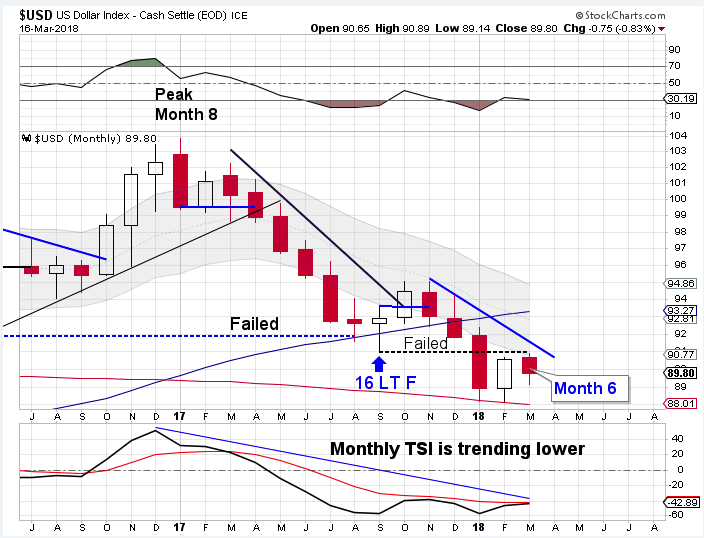
The dollar has found some support at the declining 200 month MA which makes it likely that week 23 did host the ICL. The bigger picture is that the dollar is already in a failed yearly cycle. Therefore our cyclical expectation is to see the new intermediate cycle left translate and continue the yearly cycle decline. The dollar is in a monthly downtrend. The dollar will remain in its monthly downtrend until it can close back above the upper monthly cycle band.
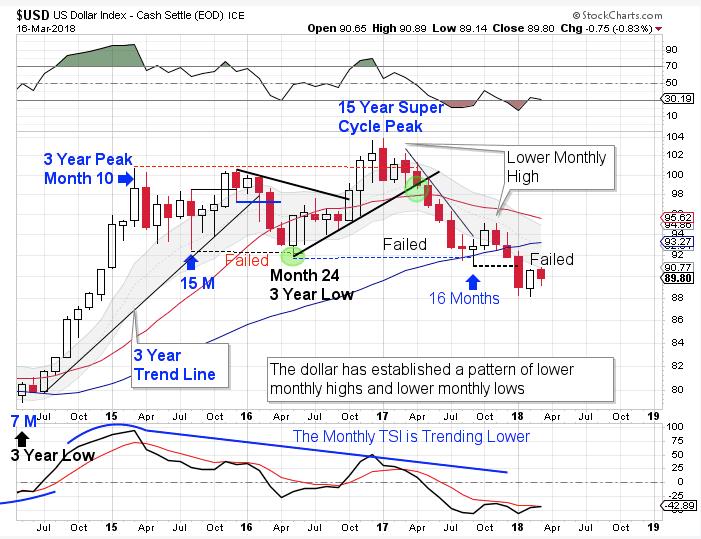
The dollar broke below the previous 3 year cycle low in September to form a failed 3 year cycle. The dollar then delivered another failed yearly cycle in January. Since the dollar broke below the May 2016 low in September to form a failed 3 year cycle it has been our expectation has been to see left translated yearly cycles form until the dollar prints its next 3 year cycle low. And with confirmation of a failed 3 year cycle, this sets up as a left translated 3 year cycle. That aligns with our 15 year super cycle analysis.
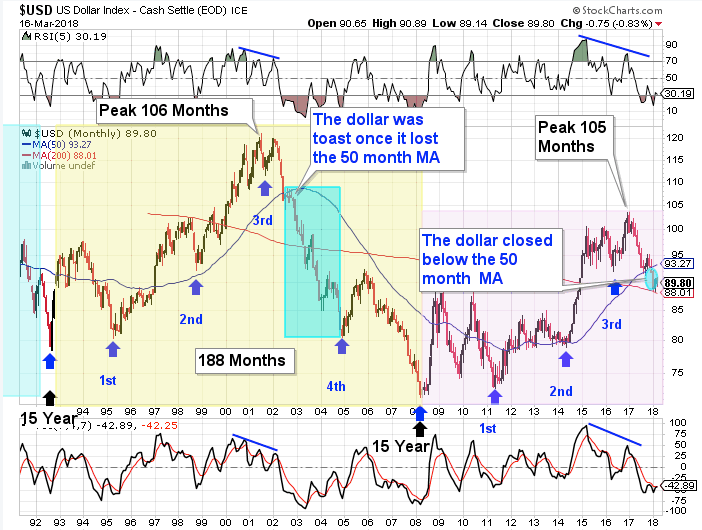
The dollar cycles through a 15 year super cycle. Each 15 year super cycle is embedded with five 3 year cycles. The dollar’s last 15 year super cycle peaked in 2001 on month 106, then declined into its third 3 year cycle low. The topping pattern in 2001 is very similar to the current set up. The confirmation of a failed 3 year cycle confirms that the dollar has begun its 15 year super cycle decline (bear market).
Stocks
Stocks broke out to a new high on Tuesday. A new high on day 21, or later, indicates a right translated daily cycle formation.
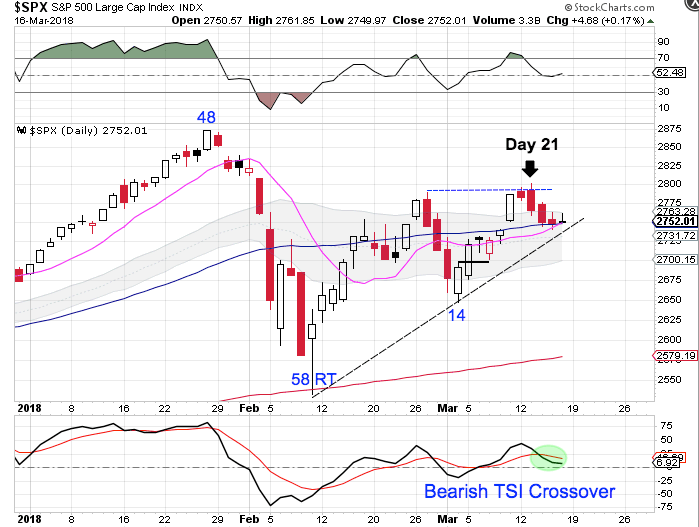
Stocks have drifted lower since printing a new high on day 21. At this point a close below the 10 day MA along with a break below the daily cycle trend line would confirm the daily cycle decline. Stocks are in a daily uptrend. They will remain in their uptrend unless they close below the lower daily cycle band
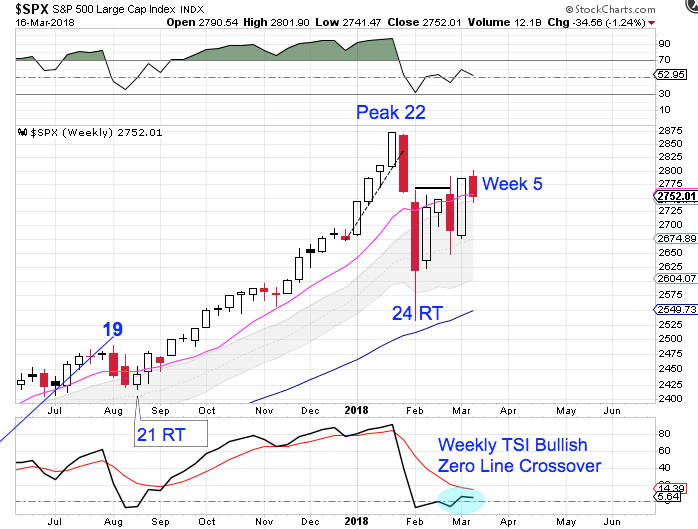
This is week 5 of the new intermediate cycle. I believe that stocks are rallying out of their yearly cycle low. The first intermediate cycle out of the yearly cycle low should form as a right translated weekly cycle. Considering that the previous to weekly cycles peaked at weeks 19 and 22 respectively indicates that this intermediate rally has only begun. Stocks are in a weekly uptrend. They will remain in their weekly uptrend unless they close below the lower weekly cycle band.
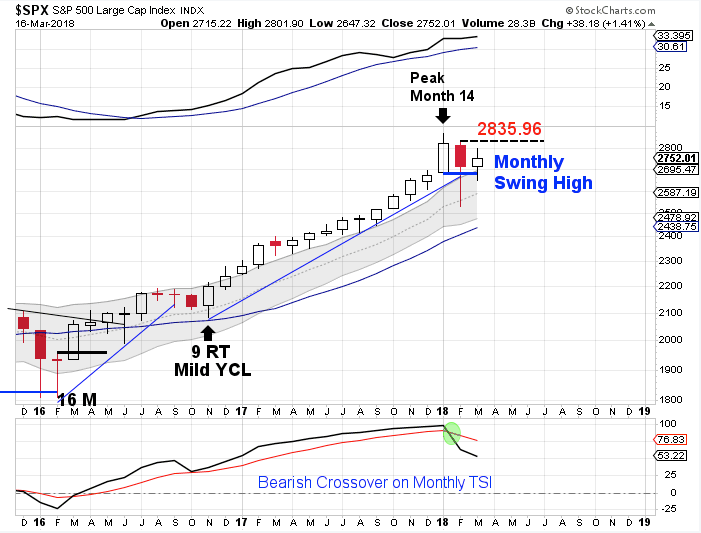
The yearly equity cycle peaked in January. February was month 15, placing stocks late in their timing band for a yearly cycle low. Stocks have formed a clear and convincing monthly swing high and delivered a break of the monthly trend line to signal the yearly cycle decline. Now once a monthly swing low forms, that will signal the new yearly cycle. A break above February high of 2835.96 will form a monthly swing low.
Author

LikesMoney
Independent Analyst
Assets (such as stocks, gold, and the dollar) have identifiable cycles.


