EUR/USD Current Price: 1.1257
View Live Chart for the EUR/USD
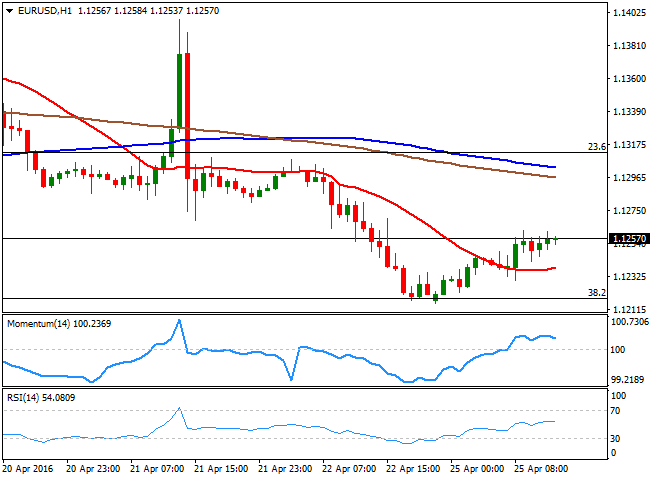
The EUR/USD pair trades uneventfully this Monday, between 1.1215, the low set at the beginning of the day and 1.1262, the highest of the European session. Germany released the IFO survey's results for April, showing that business confidence decreased alongside with the assessment of the current situation, suggesting the economic slowdown seen during the first quarter of the year continues. Still pending of release, the US will offer its latest New Home sales figures during the upcoming session, expected to have grew modestly during March.
In the meantime, the pair remains near its daily high, but lacking directional strength, although limited towards the downside, as in the 1 hour chart, the price is above a flat 20 SMA, whilst the technical indicators are turning lower within positive territory. In the 4 hours chart, the technical bias favors the downside, as the 20 SMA has extended its decline above the current level, and maintains a strong downward slope, whilst the technical indicators are turning south below their mid-lines, after correcting from oversold levels.
Support levels: 1.1220 1.1160 1.1120
Resistance levels: 1.1280 1.1315 1.1340
GBP/USD Current price: 1.4502
View Live Chart for the GBP/USD
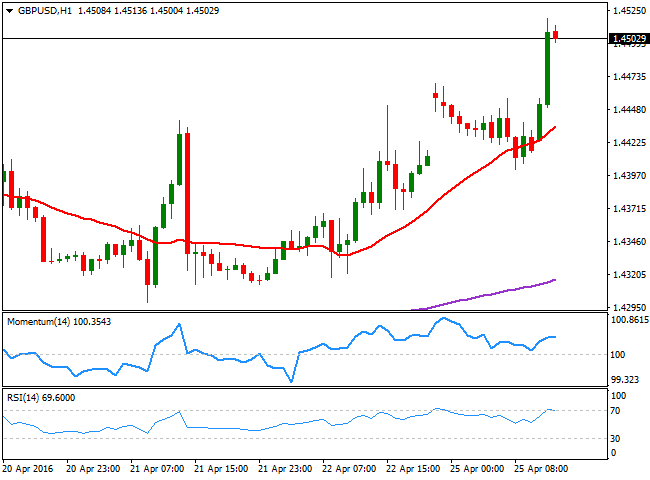
The Pound outperforms its major rivals this Monday, having advanced against the greenback up to 1.4518, surpassing by a couple of pips the high established on March 18th. Supporting the UK currency is a bounce in local share markets which opened down, and investors' decision to stay away from the EUR and the JPY, ahead of the upcoming FED and BOJ's meetings. In the macroeconomic front, the CBI Industrial Trends survey, showed that manufacturing activity fell by less than expected in March, due to a dip in export orders, whilst domestic orders were broadly flat. Nevertheless, the GBP/USD pair holds above the 1.4500 level, and in the 1 hour chart, the price is well above a now bullish 20 SMA, whilst the technical indicators are losing upward strength near overbought readings, supporting some short term consolidation/retracement. In the 4 hours chart, however, the technical indicators present a strong upward momentum, whilst the 20 SMA accelerates higher far below the current level, indicating that the bullish potential is still strong.
Support levels: 1.4465 1.4420 1.4370
Resistance levels: 1.4520 1.4555 1.4600
USD/JPY Current price: 110.85
View Live Chart for the USD/JPY
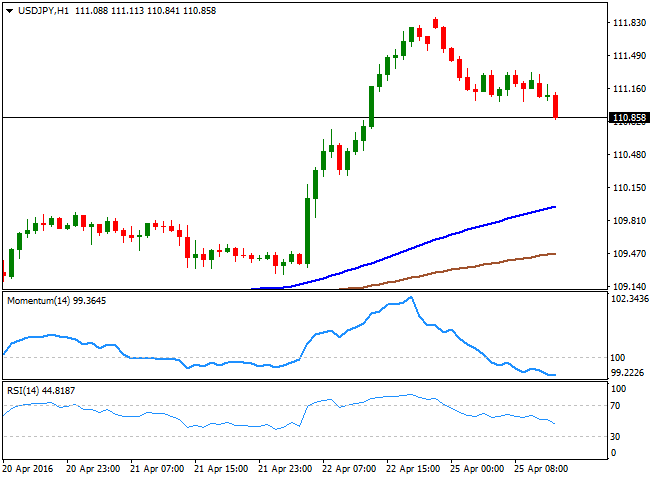
Further slides below 110.65. The USD/JPY pair retreats below the 111.00 level ahead of the US opening, following news coming from Japan that suggest more easing will come in June, and not in this week meeting as initially suspected. The generally weak tone of the greenback is also supporting the intraday decline that could be exacerbated by a negative result of the upcoming US housing data. From a technical point of view, the 1 hour chart shows that the price is still far above its 100 SMA, currently around 110.00, but that the technical indicators head sharply lower within bearish territory, supporting some additional declines on a break below 110.65, a major static support level. In the 4 hours chart, the price is back below a bearish 200 SMA, whilst the technical indicators retreat from extreme overbought territory, supporting the shorter term outlook.
Support levels: 110.65 110.30 109.80
Resistance levels: 111.00 111.40 11.90
AUD/USD Current price: 0.7720
View Live Chart for the AUD/USD
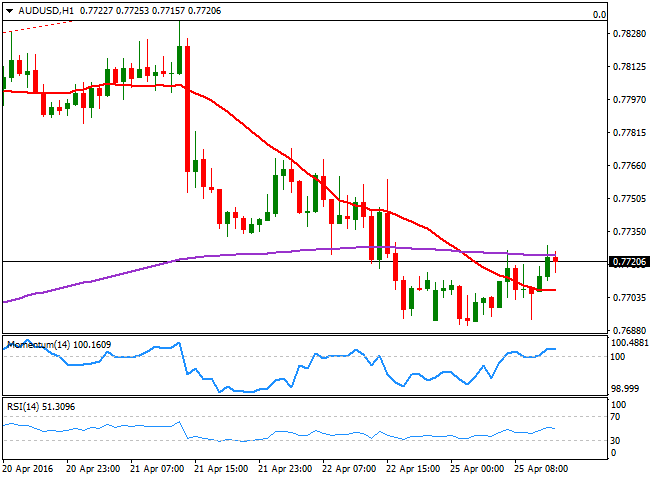
The AUD/USD pair is gaining some bullish track ahead of the US opening, recovering from a daily low of 0.7690 posted at the beginning of the week. With Australia down on holidays, the pair saw little action at the beginning of the day, now waiting for US traders to define where to go today. Technically, the 1 hour chart presents a neutral stance, with the price a few pips above a horizontal 20 SMA and the indicators heading nowhere around their mid-lines. In the 4 hours chart, however, the risk is towards the downside, as the price is well below a bearish 20 SMA, currently around 0.7760, whilst the technical indicators stand well below their mid-lines, showing no certain directional strength.
Support levels: 0.7690 0.7660 0.7620
Resistance levels: 0.7760 0.7790 0.7835
Information on these pages contains forward-looking statements that involve risks and uncertainties. Markets and instruments profiled on this page are for informational purposes only and should not in any way come across as a recommendation to buy or sell in these assets. You should do your own thorough research before making any investment decisions. FXStreet does not in any way guarantee that this information is free from mistakes, errors, or material misstatements. It also does not guarantee that this information is of a timely nature. Investing in Open Markets involves a great deal of risk, including the loss of all or a portion of your investment, as well as emotional distress. All risks, losses and costs associated with investing, including total loss of principal, are your responsibility. The views and opinions expressed in this article are those of the authors and do not necessarily reflect the official policy or position of FXStreet nor its advertisers. The author will not be held responsible for information that is found at the end of links posted on this page.
If not otherwise explicitly mentioned in the body of the article, at the time of writing, the author has no position in any stock mentioned in this article and no business relationship with any company mentioned. The author has not received compensation for writing this article, other than from FXStreet.
FXStreet and the author do not provide personalized recommendations. The author makes no representations as to the accuracy, completeness, or suitability of this information. FXStreet and the author will not be liable for any errors, omissions or any losses, injuries or damages arising from this information and its display or use. Errors and omissions excepted.
The author and FXStreet are not registered investment advisors and nothing in this article is intended to be investment advice.
Recommended Content
Editors’ Picks
EUR/USD edges lower toward 1.0700 post-US PCE

EUR/USD stays under modest bearish pressure but manages to hold above 1.0700 in the American session on Friday. The US Dollar (USD) gathers strength against its rivals after the stronger-than-forecast PCE inflation data, not allowing the pair to gain traction.
GBP/USD retreats to 1.2500 on renewed USD strength

GBP/USD lost its traction and turned negative on the day near 1.2500. Following the stronger-than-expected PCE inflation readings from the US, the USD stays resilient and makes it difficult for the pair to gather recovery momentum.
Gold struggles to hold above $2,350 following US inflation

Gold turned south and declined toward $2,340, erasing a large portion of its daily gains, as the USD benefited from PCE inflation data. The benchmark 10-year US yield, however, stays in negative territory and helps XAU/USD limit its losses.
Bitcoin Weekly Forecast: BTC’s next breakout could propel it to $80,000 Premium

Bitcoin’s recent price consolidation could be nearing its end as technical indicators and on-chain metrics suggest a potential upward breakout. However, this move would not be straightforward and could punish impatient investors.
Week ahead – Hawkish risk as Fed and NFP on tap, Eurozone data eyed too

Fed meets on Wednesday as US inflation stays elevated. Will Friday’s jobs report bring relief or more angst for the markets? Eurozone flash GDP and CPI numbers in focus for the Euro.