EUR/USD Current Price: 1.1320
View Live Chart for the EUR/USD
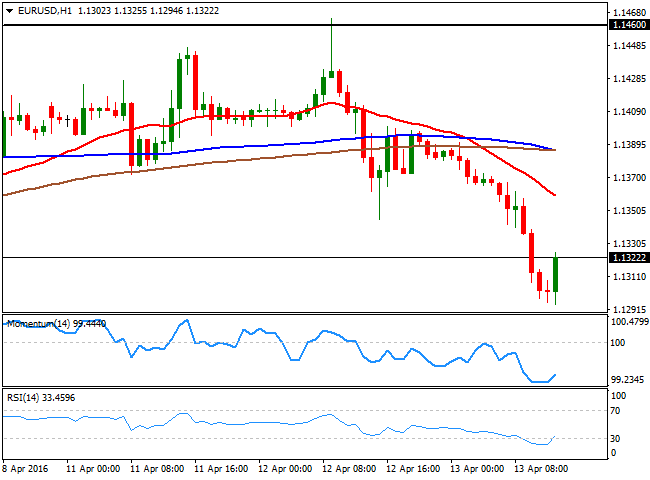
The EUR/USD pair plummeted below the 1.1300 level during the European morning, as a better-than-expected Chinese trade balance for March, fueled risk appetite, sending stocks sharply higher in Asian and Europe, and weighing on the EUR. According to official data, exports rose by 11.5% while imports decreased less-than-expected, by 7.6% yearly basis, while the trade balance came in at $29.86bn against previous $32.59bn. Data suggest that the economic slowdown seen late 2015 may have started to recede in the first quarter of this 2016.
The release of US data, stalled dollar's gains as Retail Sales for March fell by 0.3% against expectations of a 0.1% advance. The core reading posted a 0.2% against expectations of 0.4%. The Producer Price index was a huge disappointment, down 0.1% monthly and yearly basis. The ex food and energy figures also missed expectations.
The EUR/USD pair bounced from a daily low of 1.1294, and in the 1 hour chart, the technical indicators have turned sharply higher within oversold territory, but the price remains well below a bearish 20 SMA, currently around 1.1360. In the 4 hours chart, the technical indicators have stalled their declines near oversold territory, but remain far below their mid-lines, as the 20 SMA gains a limited bearish slope around 1.1390. Overall, the movement has been corrective, and the pair may recover further if it regains the 1.1330 region, yet a break below 1.1280 should see the pair extending its decline towards the 1.1200 region later today.
Support levels: 1.1280 1.1245 1.1200
Resistance levels: 1.1335 1.1380 1.1420
GBP/USD Current price: 1.4246
View Live Chart for the GBP/USD
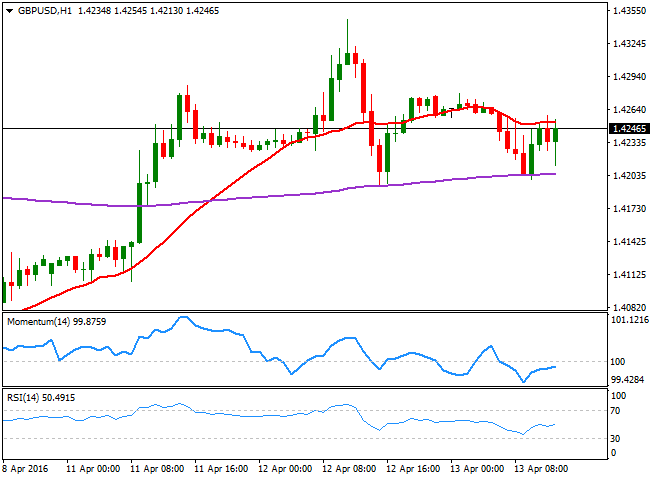
The GBP/USD pair trades a few pips below its daily opening, maintaining a neutral stance daily basis. An early slide met buying interest at 1.4190/200, the immediate support. There were no macroeconomic releases in the UK, and US data indeed should maintain the downside limited. Nevertheless, the 1 hour chart shows that the price is unable to advance beyond a horizontal 20 SMA, whilst the technical indicators hold flat below their mid-lines, with no signs of upward strength. In the 4 hours chart, the pair bounced from a bullish 20 SMA but consolidates around the 200 EMA, whilst the technical indicators retreat from overbought levels, but lost the downward strength and hover directionless within positive territory.
Support levels: 1.4190 1.4150 1.4110
Resistance levels: 1.4285 1.4330 1.4370
USD/JPY Current price: 108.59
View Live Chart for the USD/JPY
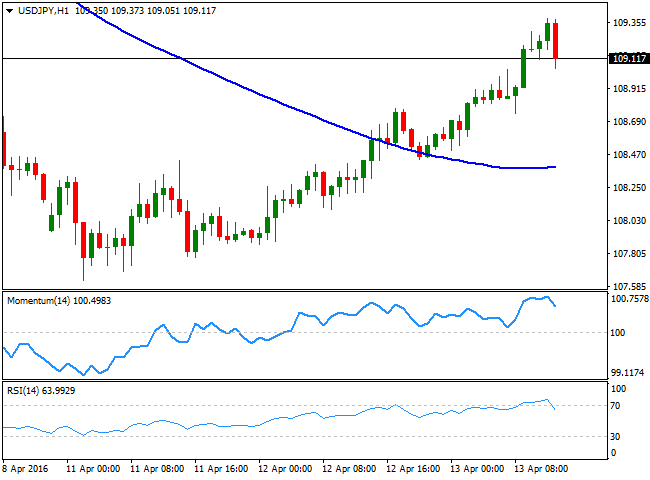
Holding above 109.00. The Japanese yen weakened this Wednesday, as improved market´s sentiment forced yen bulls to take some profits out of the table. The USD/JPY rallied up to 109.38, and currently retreats on the back of poor US data, as March Retail Sales fell, while inflation at production levels grew less than expected. Still holding above the 109.00 figure, the 1 hour chart shows that the pair advanced above its 100 SMA for the first time since late March, with the 200 SMA now offering an immediate resistance at 109.60. In the same chart, the technical indicators have turned lower within overbought territory, indicating the pair may extend its decline particularly on a break below the 109.00 figure. In the 4 hours chart, the technical indicators have lost upward strength near overbought levels, but are far from suggesting a downward move at the current levels.
Support levels: 108.90 108.40 107.95
Resistance levels: 109.60 110.00 110.45
Information on these pages contains forward-looking statements that involve risks and uncertainties. Markets and instruments profiled on this page are for informational purposes only and should not in any way come across as a recommendation to buy or sell in these assets. You should do your own thorough research before making any investment decisions. FXStreet does not in any way guarantee that this information is free from mistakes, errors, or material misstatements. It also does not guarantee that this information is of a timely nature. Investing in Open Markets involves a great deal of risk, including the loss of all or a portion of your investment, as well as emotional distress. All risks, losses and costs associated with investing, including total loss of principal, are your responsibility. The views and opinions expressed in this article are those of the authors and do not necessarily reflect the official policy or position of FXStreet nor its advertisers. The author will not be held responsible for information that is found at the end of links posted on this page.
If not otherwise explicitly mentioned in the body of the article, at the time of writing, the author has no position in any stock mentioned in this article and no business relationship with any company mentioned. The author has not received compensation for writing this article, other than from FXStreet.
FXStreet and the author do not provide personalized recommendations. The author makes no representations as to the accuracy, completeness, or suitability of this information. FXStreet and the author will not be liable for any errors, omissions or any losses, injuries or damages arising from this information and its display or use. Errors and omissions excepted.
The author and FXStreet are not registered investment advisors and nothing in this article is intended to be investment advice.
Recommended Content
Editors’ Picks
EUR/USD edges lower toward 1.0700 post-US PCE

EUR/USD stays under modest bearish pressure but manages to hold above 1.0700 in the American session on Friday. The US Dollar (USD) gathers strength against its rivals after the stronger-than-forecast PCE inflation data, not allowing the pair to gain traction.
GBP/USD retreats to 1.2500 on renewed USD strength

GBP/USD lost its traction and turned negative on the day near 1.2500. Following the stronger-than-expected PCE inflation readings from the US, the USD stays resilient and makes it difficult for the pair to gather recovery momentum.
Gold struggles to hold above $2,350 following US inflation

Gold turned south and declined toward $2,340, erasing a large portion of its daily gains, as the USD benefited from PCE inflation data. The benchmark 10-year US yield, however, stays in negative territory and helps XAU/USD limit its losses.
Bitcoin Weekly Forecast: BTC’s next breakout could propel it to $80,000 Premium

Bitcoin’s recent price consolidation could be nearing its end as technical indicators and on-chain metrics suggest a potential upward breakout. However, this move would not be straightforward and could punish impatient investors.
Week ahead – Hawkish risk as Fed and NFP on tap, Eurozone data eyed too

Fed meets on Wednesday as US inflation stays elevated. Will Friday’s jobs report bring relief or more angst for the markets? Eurozone flash GDP and CPI numbers in focus for the Euro.