EUR/USD Current price: 1.1006
View Live Chart for the EUR/USD
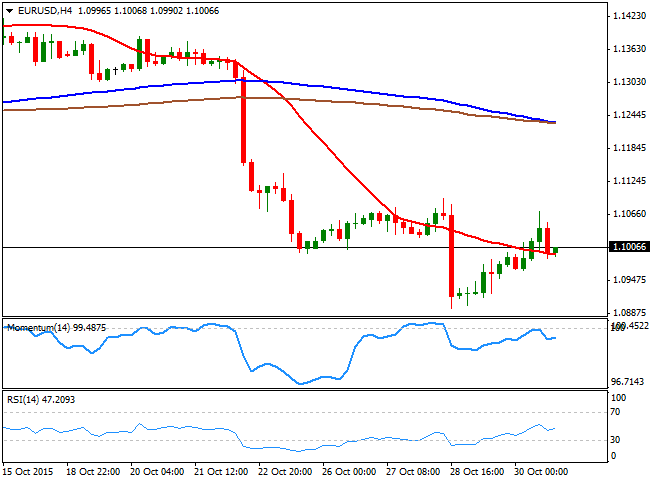
Month-end profit taking sent the greenback lower across the board last Friday, although the decline faded before the closing bell. The EUR enjoyed of some temporal demand, rising against its American rival up to 1.1072, before selling interest re-surged. Macroeconomic news by the end of the week showed that the Euro area annual inflation in October met expectations of 0.0% against previous -0.1%, in line with market's forecast. In the US, Consumer Sentiment missed expectations, resulting at 90.0, and below a preliminary reading of 92.1, while Personal Income and Spending, both grew at the slowest pace since January in September, up by 0.1% each.The EUR/USD pair ended the week right above the 1.1000 level, and the dominant bearish trend remains in place, given that the daily chart shows that selling interest surged on an approach to the 200 DMA, whilst the Momentum indicator maintains a strong bearish, despite being in oversold territory. In the same chart, the RSI indicator has managed to bounce from oversold levels, but remains well into negative territory, leaving room for additional declines. In the 4 hours chart, the pair is struggling around a bearish 20 SMA, whilst the technical indicators have failed to advance above their mid-lines, but lack enough bearish strength to confirm a bearish movement ahead.
Support levels: 1.0960 1.0920 1.0880
Resistance levels: 1.1050 1.1090 1.1125
EUR/JPY Current price: 132.68
View Live Chart for the EUR/JPY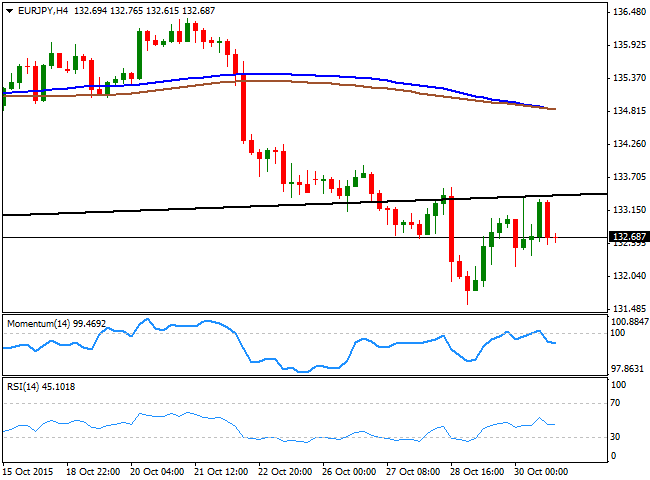
The EUR/JPY pair closed the day in the red, as the Japanese Yen got an early boost from BOJ's decision to leave rates on-hold. Bank of Japan governor Kuroda offered a pretty hawkish speech, reporting that the economy has continued to recover moderately, despite the slowdown in emerging markets. He also said that they expect that inflation will reach its 2% target in the second half of the 2016 fiscal year. The EUR/JPY pair recovered from a daily low of 132.21 and reached 133.38 before reversing. Daily basis, selling interest continued to surge around the base of the symmetrical triangle, broken last week, while the technical indicators have resumed their declines well into negative territory after correcting oversold readings, all of which continues to favor the downside. In the 4 hours chart, the price stands below its moving averages, whilst the technical indicators head slightly lower below their mid-lines, in line with the longer term view.
Support levels: 132.10 131.60 131.10
Resistance levels: 133.10 133.50 134.00
GBP/USD Current price: 1.5427
View Live Chart for the GPB/USD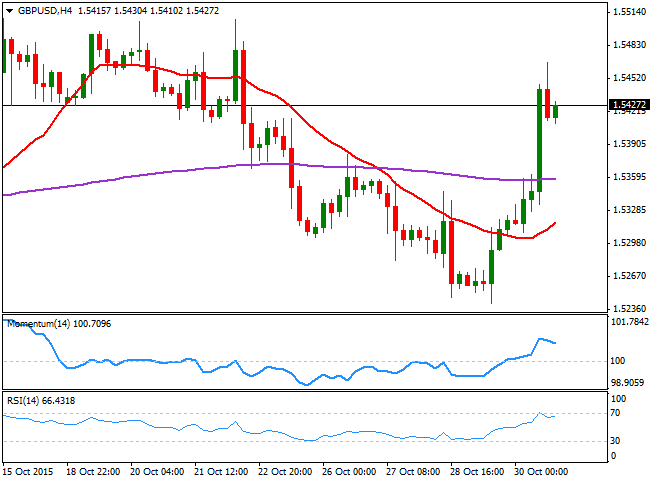
The British Pound was the best performer last Friday, soaring up to 1.5466 against the dollar, and closing the day with solid gains above the 1.5400 figure. It did not take much for the Pound to recover in a dollar-bearish environment, given that investors are pretty much convinced the BOE will start tightening its rates during the first half of 2016. This week, the UK will release its latest inflation report, alongside with the Central Bank meeting and the release of the corresponding Minutes. Although the report will likely reckon the persisting downward risk in inflation, and no changes are expected in the ongoing economic policy, investors will be looking for any clue on upcoming decisions. The pair has been trading in a well-defined range during the past three weeks, which leaves the technical indicators with no clear directional strength, diverging from each other around their mid-lines. Nevertheless, the pair has managed to recover above a mild bullish 20 SMA. In the shorter term, the 4 hours chart shows that the technical indicators are showing limited signs of exhaustion in overbought territory, but that the price is well above its 20 SMA, supporting additional gains on a break above the mentioned high.
Support levels: 1.5415 1.5375 1.5330
Resistance levels: 1.5465 1.5500 1.5540
USD/JPY Current price: 120.59
View Live Chart for the USD/JPY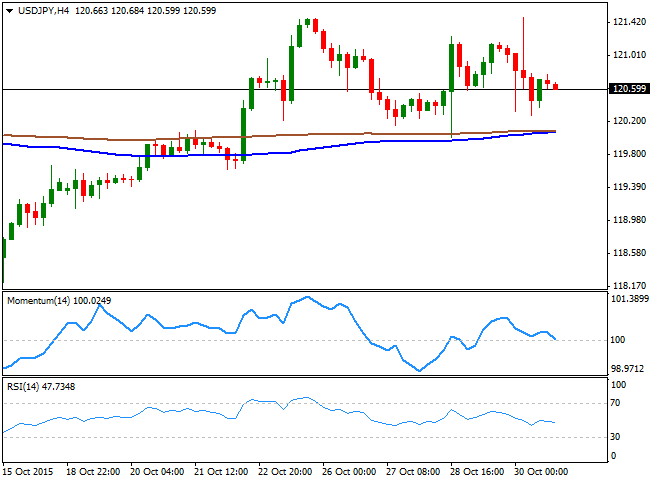
The Japanese yen appreciated against most of its rivals last Friday, after the Bank of Japan decided to stand pat on monetary policy. The USD/JPY pair initially spiked up to 121.47, but quickly retreated and closed the day at 120.59. Although the Central Bank offered quite an optimistic outlook, officers pushed back their 2% inflation goal into the second half of the FY2016, which ends March 2017, leaving doors opened for additional stimulus. From a technical point of view, the pair continues struggling to find direction, still holding within its latest monthly range. In the daily chart, the price retraced after failing to overcome its 200 DMA, a major dynamic resistance, given that it has contained advances since late August. In the same chart, the RSI indicator has turned lower and currently stands around 52, anticipating some additional declines for this Monday. In the 4 hours chart, the technical indicators have also turned south and are crossing their mid-lines towards the downside, whilst the 100 and 200 SMAs converge around 120.10, providing and immediate short term support.
Support levels: 120.10 119.70 119.35
Resistance levels: 120.90 121.40 121.80
AUD/USD Current price: 0.7137
View Live Chart for the AUD/USD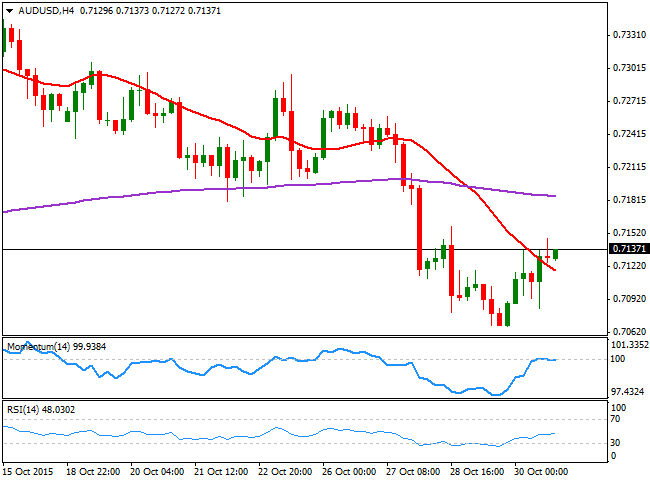
The AUD/USD pair benefited by month-end fixing, surging on the back of commodities' demand by London's close. Nevertheless, the pair closed its third consecutive week with losses, ahead of the upcoming RBA economic policy meeting next Tuesday. The Australian Central Bank is largely expected to maintain its rates at 2.0%, although latest disappointing inflation data, may suggest a more dovish stance from authorities, which may raise speculation over an upcoming rate cut in the near future. The bearish tone seems set to extend during the upcoming days, as the daily chart shows that the price is currently below its 20 SMA, whilst the Momentum indicator has resumed its decline well into negative territory and the RSI indicator hovers around 45. In the 4 hours chart the technical indicators have managed to correct the extreme oversold levels reached last Thursday, but lost upward strength after reaching their mid-lines, whilst the price stands a handful of pips above a bearish 20 SMA, all of which maintains the risk towards the downside, particularly on renewed selling interest below the 0.7100 level.
Support levels: 0.7100 0.7065 0.7020
Resistance levels: 0.7160 0.7195 0.7240
Information on these pages contains forward-looking statements that involve risks and uncertainties. Markets and instruments profiled on this page are for informational purposes only and should not in any way come across as a recommendation to buy or sell in these assets. You should do your own thorough research before making any investment decisions. FXStreet does not in any way guarantee that this information is free from mistakes, errors, or material misstatements. It also does not guarantee that this information is of a timely nature. Investing in Open Markets involves a great deal of risk, including the loss of all or a portion of your investment, as well as emotional distress. All risks, losses and costs associated with investing, including total loss of principal, are your responsibility. The views and opinions expressed in this article are those of the authors and do not necessarily reflect the official policy or position of FXStreet nor its advertisers. The author will not be held responsible for information that is found at the end of links posted on this page.
If not otherwise explicitly mentioned in the body of the article, at the time of writing, the author has no position in any stock mentioned in this article and no business relationship with any company mentioned. The author has not received compensation for writing this article, other than from FXStreet.
FXStreet and the author do not provide personalized recommendations. The author makes no representations as to the accuracy, completeness, or suitability of this information. FXStreet and the author will not be liable for any errors, omissions or any losses, injuries or damages arising from this information and its display or use. Errors and omissions excepted.
The author and FXStreet are not registered investment advisors and nothing in this article is intended to be investment advice.
Recommended Content
Editors’ Picks
EUR/USD edges lower toward 1.0700 post-US PCE

EUR/USD stays under modest bearish pressure but manages to hold above 1.0700 in the American session on Friday. The US Dollar (USD) gathers strength against its rivals after the stronger-than-forecast PCE inflation data, not allowing the pair to gain traction.
GBP/USD retreats to 1.2500 on renewed USD strength

GBP/USD lost its traction and turned negative on the day near 1.2500. Following the stronger-than-expected PCE inflation readings from the US, the USD stays resilient and makes it difficult for the pair to gather recovery momentum.
Gold struggles to hold above $2,350 following US inflation

Gold turned south and declined toward $2,340, erasing a large portion of its daily gains, as the USD benefited from PCE inflation data. The benchmark 10-year US yield, however, stays in negative territory and helps XAU/USD limit its losses.
Bitcoin Weekly Forecast: BTC’s next breakout could propel it to $80,000 Premium

Bitcoin’s recent price consolidation could be nearing its end as technical indicators and on-chain metrics suggest a potential upward breakout. However, this move would not be straightforward and could punish impatient investors.
Week ahead – Hawkish risk as Fed and NFP on tap, Eurozone data eyed too

Fed meets on Wednesday as US inflation stays elevated. Will Friday’s jobs report bring relief or more angst for the markets? Eurozone flash GDP and CPI numbers in focus for the Euro.
