EUR/USD Current price: 1.1433
View Live Chart for the EUR/USD
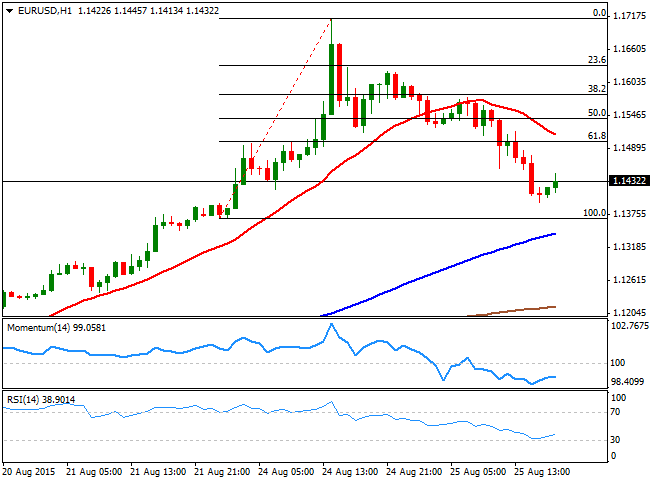
The EUR/USD pair retraced most of yesterday's gains, falling down to 1.1396 before bouncing some 30 pips, to end the day above the 1.1400 mark. Chinese stocks fell another 7.63%, forcing the PBoC to make another intervention: the Central Bank cut its lending rate for fifth time since November, lowering also the banks' reserve ratio. The action that took place mid European session, boosted an already on-demand dollar that advanced, despite tepid US data. American new home sales rose by 0.507M beating previous month readings, but missing estimations of 0.520M, whilst the Markit Services PMI for Augusts printed 55.2 against 56.0 expected. A strong recovery in European and American indices helped stabilizing the currency market, supporting the greenback.
Technically, the downward move seems to have a short term bottom, as the technical indicators are recovering partially from near oversold levels, whilst the 100 SMA has advanced well above the 200 SMA, both below the current level, with the shortest offering a strong support around 1.1345. In the 4 hours chart the price is recovering after a brief decline below its 20 SMA, whilst the technical indicators have erased their overbought readings, and now turn flat, well above their mid-lines. Nevertheless, to confirm a stronger recovery, the pair needs to advance beyond 1.1500, the 61.8% retracement of Monday's fall.
Support levels: 1.1390 1.1345 1.1300
Resistance levels: 1.1455 1.1500 1.1540
EUR/JPY Current Price: 136.80
View Live Chart for the EUR/JPY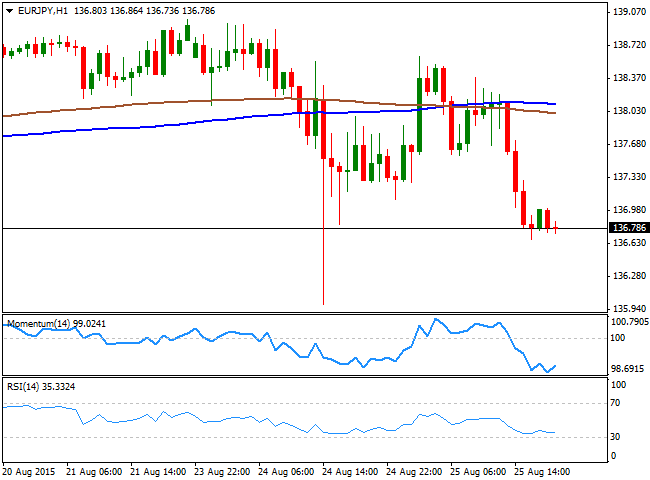
The EUR/JPY saw an early advance up to 138.60 during the previous Asian opening, but closed in the red for second day in-a-row, weighed by a weaker EUR. The pair closed the day a handful of pips above its daily low set at 136.67, and the 1 hour chart shows that the technical indicators are aiming to bounce now oversold readings, but that the price is well below the 100 and 200 SMAs, both in the 137.90/138.00 region. In the 4 hours chart, the technical indicators are aiming to resume their declines well below their mid-lines, whilst the price has broken back below its 100 SMA, risking further declines on a break below 136.65, the immediate support.
Support levels: 136.65 136.20 135.55
Resistance levels: 137.25 137.70 138.10
GBP/USD Current price: 1.5688
View Live Chart for the GPB/USD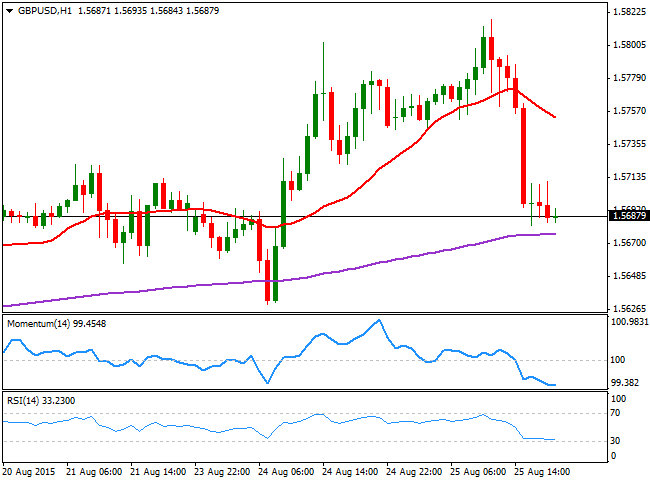
The GBP/USD pair surged to a fresh 2-month high of 1.5817 early European morning, following the upward momentum in stocks' share markets, but gave up later in the day, dipping down to 1.5681, where it stands by the end of the day. US Consumer Confidence surged in August to 101.5 from previous 91.0, giving the dollar a lift against its British rival. There were no macroeconomic releases in the UK, and the calendar will remain light until Friday, when Britain will release the latest review of its second quarter GDP figures. The pair is biased lower in the short term, as in the 1 hour chart, the price is well below a bearish 20 SMA, whilst the Momentum indicator heads lower near oversold levels and the RSI indicator consolidates around 30. In the 4 hours chart, and according to the latest candle, the pair is unable to recover above a still bullish 20 SMA, whilst the technical indicator have reached their mid-lines, now posting tepid bounces that are not enough to confirm a recovery. The pair needs to retake the 1.5735 level to shrug off the negative tone, and be able to resume its advance, back towards the mentioned high.
Support levels: 1.5680 1.5635 1.5590
Resistance levels: 1.5735 1.5770 1.5815
USD/JPY Current price: 119.66
View Live Chart for the USD/JPY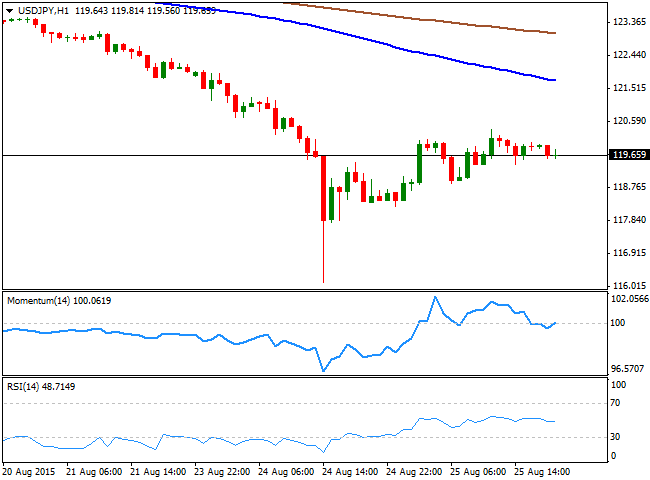
The USD/JPY pair stabilized below the 120.00 level, having been as high as 120.39, closing with gains amid PM Abe advisor Hamada comments, suggesting the country may need more easing if GDP readings for the third quarter fail to show growth. The Nikkei posted another day of sharp losses, but Wall Street's recover, helped the index to recover most of it in electronic trading. The 1 hour chart shows that the price has been confined to a tight range during most of the American session, with the technical indicators posting tepid advances around their mid-lines, actually lacking directional strength. In the same chart the 100 SMA heads lower in the 121.50 region, suggesting selling interest is still high. In the 4 hours chart, the technical indicators have lost their upward potential after correcting the extreme readings reached on Monday, but remain well below their mid-lines, in line with the shorter term view.
Support levels: 119.60 119.20 118.80
Resistance levels: 120.35 120.65 121.00
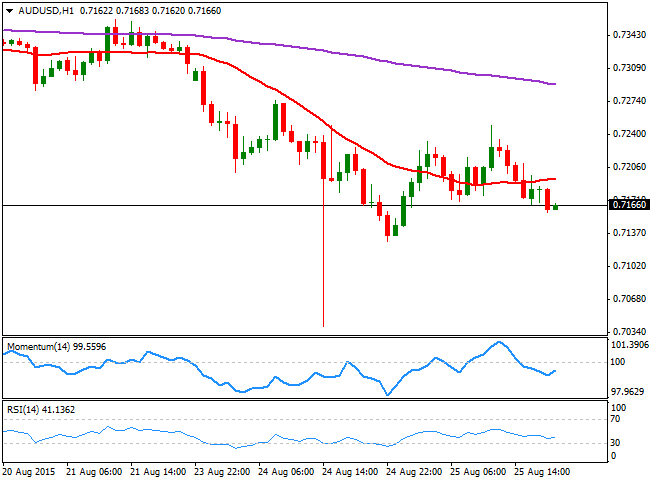
AUD/USD Current price: 0.7165
View Live Chart for the AUD/USDThe Australian dollar enjoyed some demand against its American rival earlier in the day, setting a daily high of 0.7249 before erasing most of its intraday gains, ending the day a few pips above its daily opening, on renewed dollar's demand. During the upcoming Asian session, RBA's Governor Glenn Stevens is scheduled to speak at the National Reform Summit, in Sydney. He is not particularly expected to talk about the ongoing economic policy of the country, but his remarks will be closely followed by investors. Technically, the pair presents a bearish potential in the short term, as in the 1 hour chart the price is extending below its 20 SMA, whilst the RSI indicator heads lower around 39 and the Momentum indicator holds flat below its 100 level. In the 4 hours chart, the 20 SMA maintains a sharp bearish tone, currently around 0.7240, whilst the technical indicators lack directional strength near oversold levels, maintaining the risk towards the downside, and favoring additional declines on a break below 0.7125 the immediate support.
Support levels: 0.7125 0.7075 0.7030
Resistance levels: 0.7165 0.7200 0.7240
Recommended Content
Editors’ Picks
AUD/USD eases toward 0.6500 after mixed Australian trade data

AUD/USD is seeing some fresh selling interest in the Asian session on Thursday, following the release of mixed Australian trade data. The pair has stalled its recovery mode, as the US Dollar attempts a bounce after the Fed-led sell-off.
USD/JPY rebounds above 156.00 after probable Japan's intervention-led crash

USD/JPY is staging a solid comeback above 156.00, having lost nearly 450 pips in some minutes after the Japanese Yen rallied hard on another suspected Japan FX market intervention in the late American session on Wednesday.
Gold price stalls rebound below $2,330 as US Dollar recovers

Gold price is holding the rebound below $2,330 in Asian trading on Thursday, as the US Dollar recovers in sync with the USD/JPY pair and the US Treasury bond yields, in the aftermath of the Fed decision and the likely Japanese FX intervention.
Top 3 Price Prediction BTC, ETH, XRP: Altcoins to pump once BTC bottoms out, slow grind up for now

Bitcoin reclaiming above $59,200 would hint that BTC has already bottomed out, setting the tone for a run north. Ethereum holding above $2,900 keeps a bullish reversal pattern viable despite falling momentum. Ripple coils up for a move north as XRP bulls defend $0.5000.
The FOMC whipsaw and more Yen intervention in focus

Market participants clung to every word uttered by Chair Powell as risk assets whipped around in a frenetic fashion during the afternoon US trading session.