EUR/USD Current price: 1.0981
View Live Chart for the EUR/USD
The dollar ended the day generally higher, advancing late in the American afternoon after the latest US Federal Reserve economic policy meeting. The US Central Bank decided by unanimous vote to keep interest rates unchanged at its July’s meeting as widely expected, but offered no hints at the timing of the lift-off in the statement. However, they pledged for a move when they see "some further improvement in the labor market" and that "a range of labor market indicators suggests that underutilization of labor resources has diminished since early this year," suggesting a rate hike in September is still on the table. Earlier in the day US Pending Sales unexpectedly fell in June, down 1.8%, the first drop this year, after a revised 0.6% increase in May.
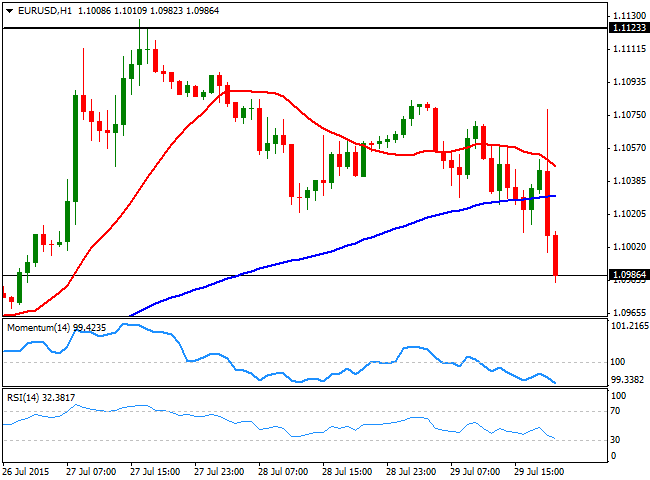
The EUR/USD pair flirted with the 1.1000 figure after an initial spike up to 1.1078 immediately after the release, breaking towards fresh lows below the critical figure the end of the day. The technical picture favors additional declines as the 1 hour chart shows that the price has accelerated below its 100 SMA whilst the technical indicators have resumed their declines well into negative territory. In the 4 hours chart, the pair is extending below its 20 SMA, whilst the technical indicators have crossed below their mid-lines and maintain strong bearish slopes below their mid-lines, supporting additional declines for this Thursday, with 1.0950 now as the next probable bearish target.
Support levels: 1.0950 1.0920 1.0860
Resistance levels: 1.1010 1.1050 1.1080
EUR/JPY Current Price: 136.34
View Live Chart for the EUR/JPY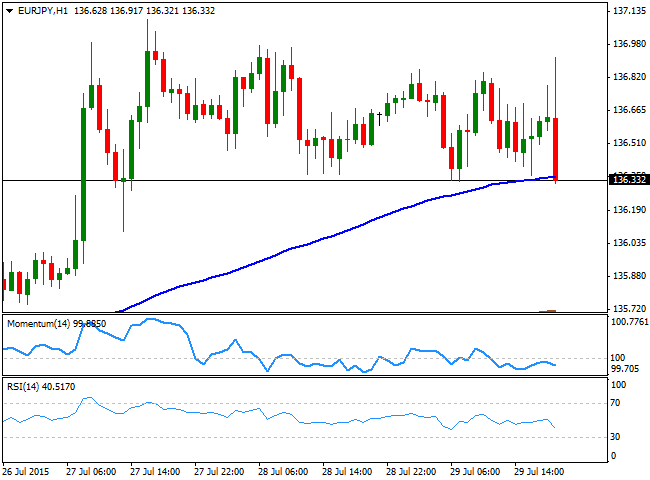
The EUR/JPY resumed its decline after the FOMC statement, with the yen refusing to give up against the greenback and the EUR weakening sharply on the news. The pair fell down to its 100 SMA in the 1 hour chart where it stands, and the technical indicators in the mentioned time frame stand below their mid-lines, with the RSI accelerating its decline around 42 and maintaining the risk towards the downside. In the 4 hours chart, the technical indicators present a mild bearish slope, with the Momentum indicator crossing the 100 level towards the downside with a limited downward strength. Additional declines are likely after the Nikkei opening, with a break below 136.00 favoring a continued decline towards the 134.40 price zone.
Support levels: 136.00 135.55 135.00
Resistance levels: 136.60 137.10 137.60
GBP/USD Current price: 1.5598
View Live Chart for the GPB/USD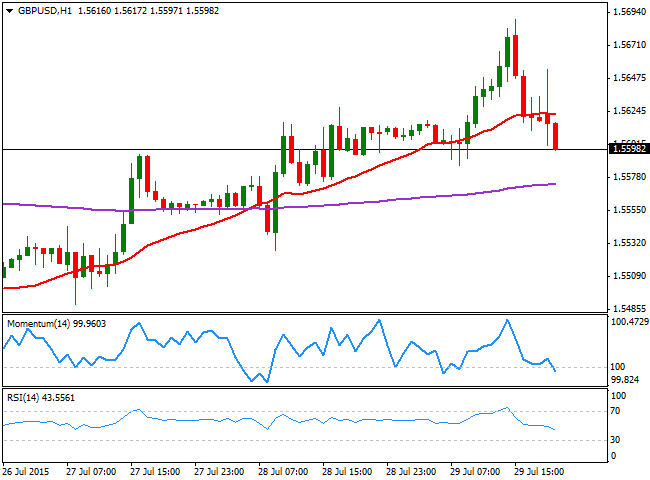 The GBP/USD pair erased all of its intraday gains post-FED, after reaching a fresh 4-week high of 1.5689 earlier in the day. The Pound was buoyed early Europe, after more positive macroeconomic news in the UK. Mortgage approvals rose more than expected in June in a sign of continued momentum in the housing market, climbing to 66,582 from an upwardly revised 64,826 in May, whilst money supply M4, increased by £3.0 billion in June. The pair began retracing before the news, and accelerated its decline afterwards, entering negative territory below the 1.5600 level by the US close. Technically, the hour chart shows that the price is now below its 10 SMA whilst the technical indicators head lower below their mid-lines, supporting additional declines in the upcoming hours. In the 4 hours chart, the downside is still limited as the 20 SMA heads higher around 1.5580 providing an immediate short term support, whilst the technical indicators have turned lower, but remain above their mid-lines.
 Support levels: 1.5580 1.5545 1.5500
Resistance levels: 1.5625 1.5670 1.5730
USD/JPY Current price: 123.93
View Live Chart for the USD/JPY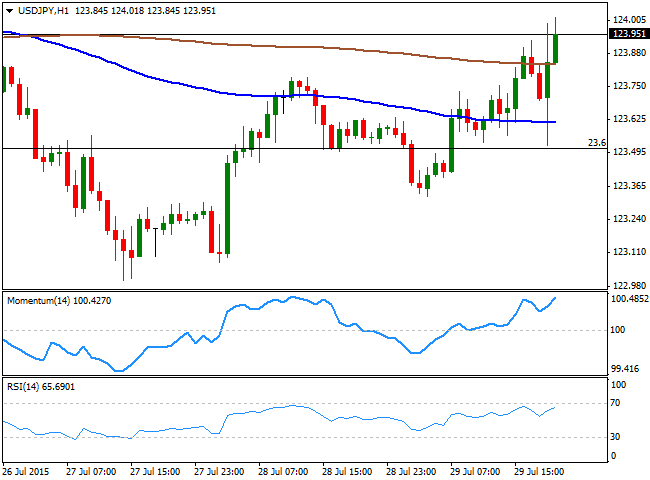
The USD/JPY is being unable to advance beyond the 124.00 figure, despite the strong dollar momentum triggered by the FED, with the pair, however, maintaining a strongly bullish intraday tone. The pair fell down to the 123.50 region with the Japanese yen finding some demand of poor US housing data. As commented several times on previous updates, the 124.00 level has kept attracting selling interest for over 2 months already, with limited spikes above it being quickly reverted, which means some steady gains beyond the highs at 124.45 are required to confirm additional advances. In the meantime, the 1 hour chart shows that the price is now above its 100 and 200 SMAs, whilst the technical indicators head sharply higher near overbought territory, favoring further gains. In the 4 hours chart the technical indicators also present strong upward slopes above their mid-lines, all of which should help in keeping the downside limited.
Support levels: 123.70 123.30 122.90
Resistance levels: 124.20 124.45 124.90
AUD/USD Current price: 0.7285
View Live Chart for the AUD/USD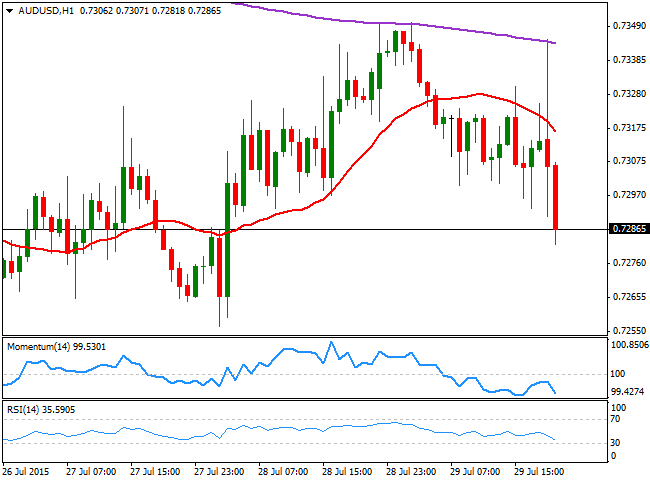
The Australian dollar approaches its multi-year low against the greenback set earlier this week at 0.7256, retreating from the 0.7340/50 region where selling interest has been capping the upside this week. Australian will release its Building Permits for June, and Exports and Imports data for the second quarter of this 2015, all of them expected well below previous figures, which may accelerate the pair's decline. Technically, the 1 hour chart shows that the price has accelerated south below its 20 MSA, whilst the technical indicators turned sharply lower below their mid-lines and extend to fresh lows, supporting the ongoing bearish tone. In the 4 hours chart, the price is below a flat 20 SMA whilst the technical indicators are crossing their mid-lines towards the downside, supporting the shorter term view. A downward acceleration below 0.7260, the immediate support, should lead to a quick test of the 0.7220/30, later followed by a break below 0.7200.
Support levels: 0.7260 0.7225 0.7185
Resistance levels: 0.7320 0.7350 0.7390
Recommended Content
Editors’ Picks
AUD/USD eases toward 0.6500 after mixed Australian trade data

AUD/USD is seeing some fresh selling interest in the Asian session on Thursday, following the release of mixed Australian trade data. The pair has stalled its recovery mode, as the US Dollar attempts a bounce after the Fed-led sell-off.
USD/JPY rebounds above 156.00 after probable Japan's intervention-led crash

USD/JPY is staging a solid comeback above 156.00, having lost nearly 450 pips in some minutes after the Japanese Yen rallied hard on another suspected Japan FX market intervention in the late American session on Wednesday.
Gold price stalls rebound below $2,330 as US Dollar recovers

Gold price is holding the rebound below $2,330 in Asian trading on Thursday, as the US Dollar recovers in sync with the USD/JPY pair and the US Treasury bond yields, in the aftermath of the Fed decision and the likely Japanese FX intervention.
Top 3 Price Prediction BTC, ETH, XRP: Altcoins to pump once BTC bottoms out, slow grind up for now

Bitcoin reclaiming above $59,200 would hint that BTC has already bottomed out, setting the tone for a run north. Ethereum holding above $2,900 keeps a bullish reversal pattern viable despite falling momentum. Ripple coils up for a move north as XRP bulls defend $0.5000.
The FOMC whipsaw and more Yen intervention in focus

Market participants clung to every word uttered by Chair Powell as risk assets whipped around in a frenetic fashion during the afternoon US trading session.