EUR/USD Current price: 1.0989
View Live Chart for the EUR/USD
The EUR/USD pair closed last week at 1.1115, around 50 pips below its previous week close, and having posted in between, a fresh 1-month low of 1.0954, as no deal was reached between Greece and its creditors. The troubled country also called for a referendum on whether or not to accept its creditors conditions for a new extension on the bailout that took place this Sunday, and the initial exit polls so far, show the "no" vote ahead. In the meantime, the country has officially defaulted in its IMF maturities last Tuesday, and risk aversion has led the financial markets, favoring the most the Japanese Yen. A "no" victory is the worst case scenario as it could mean a Grexit whether or not Europe wants it, smashing the credibility of the Union. With 85% of votes counted, 62 % of voters backed Prime Minister Alexis Tsipras, who announced negotiations with its creditors will resume on Monday.
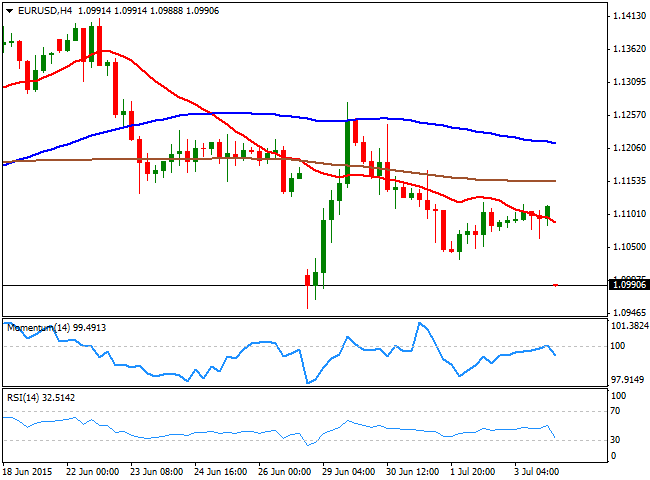
For a second week in-a-row, financial markets are expected to depend on risk sentiment and the EUR/USD pair is starting the week once again with a huge downward gap, with the price hovering below the 1.1000 level in early interbank trading. That means the price is once again pressuring its 100 DMA around the mentioned level, whilst intraday chart will show strong oversold readings, mostly a distortion as a result of the mentioned gaps. The critical support for the pair will be the 1.0954 level, last week low, as a break below it should trigger stops and fuel the decline down to 1.0820, the low set late April.
Support levels: 1.0955 1.0910 1.0860
Resistance levels: 1.1000 1.1050 1.1090
EUR/JPY Current price: 133.97
View Live Chart for the EUR/JPY
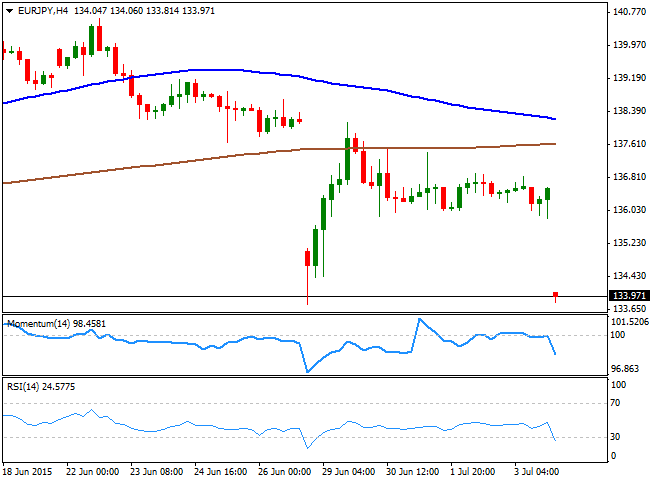
The Japanese yen is once again the first choice for investors, with the currency strongly up across the board: the EUR/JPY traded around the 134.00 level in early interbank trading, as the market runs towards safety on the back of the increased possibility of a Grexit. The pair closed last week around 136.55, pretty much flat, and with the price contained below the 100 DMA, currently around 137.00. Technically, the 4 hours chart that the price is nearing the lows set at 133.77 last Monday, with the technical indicators heading sharply lower below their mid-lines, with the price well below its moving averages, all of which should keep the risk towards the downside. Having been range bound for the last few days, the pair is now poised to extend its decline, with the mentioned support at 133.77, being the critical level to watch, as a break below it, chances are of an extension down to the 135.20 region, where the pair presents several daily lows and highs since late April.
Support levels: 133.70 133.30 132.75
Resistance levels: 134.40 134.90 135.20
GBP/USD Current price: 1.5539
View Live Chart for the GBP/USD
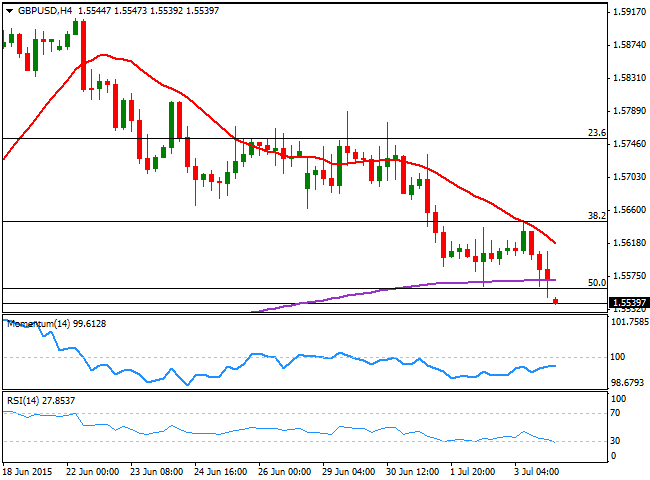
The British Pound is being weighed by dollar's demand, with the GBP/USD pair presenting a tepid downward gap at the opening, down to a fresh 3-week low. The Pound has been in a steady decline against its American counterpart ever since reaching 1.5929 mid June, having already corrected half the gains achieved post-elections. The 4 hours chart shows that the pair has started the week below the 50% retracement of the 1.5189/1.5929 rally, and below the 200 EMA, whilst the RSI indicator heads south in oversold territory and the Momentum indicator hovers flat in negative territory, supporting an extension of the ongoing downward trend. Should the price remain below the 1.5550/60, the risk turns towards 1.5470, the 61.8% retracement of the same rally. If the price manages to recover ground on the other hand, it can extend up to 1.5620 where the 20 SMA in this last time frame should provide a strong dynamic resistance.
Support levels: 1.5550 1.5520 1.5170
Resistance levels: 1.5645 1.5695 1.5730
USD/JPY Current price: 121.98
View Live Chart for the USD/JPY
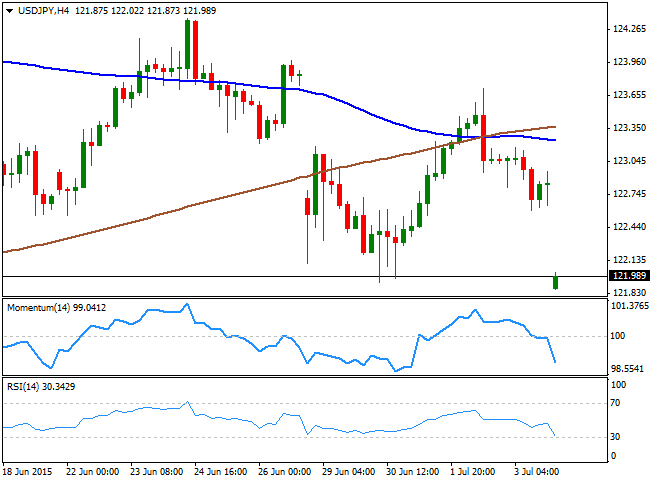
The USD/JPY pair closed last week around 122.84, weighed by a poor US employment report last Thursday that showed the economy created less jobs than expected in June, failing to support early week dollar's demand. The pair is starting the week around 100 pips below the mentioned close, and the daily chart shows that the bearish momentum has sent the price to a fresh 2-month low, as the price broke below past week low of 121.94, having been as low as 121.87 so far today. The 4 hours chart shows that the 100 SMA crossed below the 200 SMA in the 123.30 region, increasing the downward potential, whilst the technical indicators have turned sharply lower into negative territory, more reflecting the strong gap that suggesting a downward continuation. The pair can extend its decline down to 121.25, the 100 DMA, on a break below 121.70, the immediate intraday support.
Support levels: 121.70 121.25 120.80
Resistance levels: 122.40 122.90 123.30
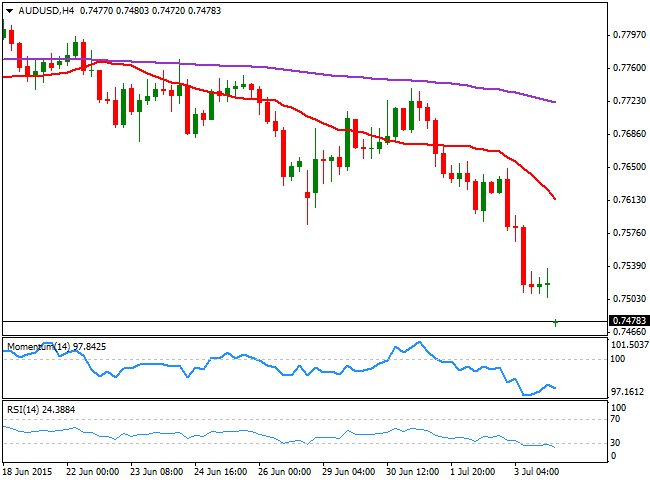
AUD/USD Current price: 0.7478
View Live Chart for the AUD/USD
The AUD/USD pair fell to a fresh 7-year low of 0.7504 last Friday, with the Aussie being dumped on the back of weak local data. The trade balance data for May showed that deficit widened beyond expected, to 2,751M, whilst Retail Sales in the same month resulted at 0.3% against expectations of 0.5%. Additionally, Chinese PMIs missing expectations and approaching contraction levels, spooked investors away from antipodean currencies. The pair is starting the week at levels not seen since May 2009, trading in the 0.7470/80 region and with the 4 hours chart showing that the 20 SMA has turned sharply lower well above the current price, whilst the technical indicators have resumed their declines in extreme oversold levels, after limited upward corrections. The former year low in the 0.7520 is the immediate resistance level to follow, as it would take a recovery above it to see the bearish pressure easing intraday, whilst additional declines below 0.7460 should lead to a decline down to the 0.7380 region during the upcoming sessions.
Support levels: 0.7460 0.7425 0.7380
Resistance levels: 0.7520 0.7555 0.7590
Recommended Content
Editors’ Picks
EUR/USD retreats below 1.0700 as USD rebounds

EUR/USD lost its traction and retreated slightly below 1.0700 in the American session, erasing its daily gains in the process. Following a bearish opening, the US Dollar holds its ground and limits the pair's upside ahead of the Fed policy meeting later this week.
USD/JPY recovers toward 157.00 following suspected intervention

USD/JPY recovers ground and trades above 156.50 after sliding to 154.50 on what seemed like a Japanese FX intervention. Later this week, the Federal Reserve's policy decisions and US employment data could trigger the next big action.
Gold holds steady above $2,330 to start the week

Gold fluctuates in a relatively tight channel above $2,330 on Monday. The benchmark 10-year US Treasury bond yield corrects lower and helps XAU/USD limit its losses ahead of this week's key Fed policy meeting.
Week Ahead: Bitcoin could surprise investors this week Premium

Two main macroeconomic events this week could attempt to sway the crypto markets. Bitcoin (BTC), which showed strength last week, has slipped into a short-term consolidation.
Five Fundamentals for the week: Fed fears, Nonfarm Payrolls, Middle East promise an explosive week Premium

Higher inflation is set to push Fed Chair Powell and his colleagues to a hawkish decision. Nonfarm Payrolls are set to rock markets, but the ISM Services PMI released immediately afterward could steal the show.
