EUR/USD Current price: 1.1259
View Live Chart for the EUR/USD
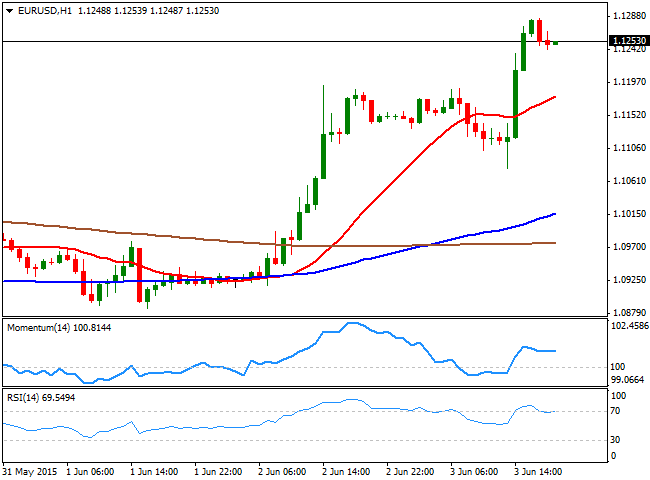
The EUR/USD pair traded lower in range for most of the first half of the day on Wednesday, with investors waiting for the ECB monthly economic meeting. The Central Bank provided little news this month, leaving its economic policy on hold, and with the introductory statement of the press conference broadly unchanged from the previous one released in April. As for economic forecast, the ECB staff kept is growth and inflation forecasts largely unchanged, with a slight downward revision for 2017 GDP, from 2.1% to 2%. Mario Draghi also emphasized the full QE implementation as long as it's needed, whilst avoided to compromise on comments regarding Greece. When asked about the matter, he stressed that the ECB is working on keeping the country within the Eurozone, albeit remarking that a "strong commitment" has to be made.
The EUR/USD pair took its time to react after the release, as the final explosion in price was due to market's attitude to bonds, rather than the currency itself. The commitment to keep on buying assets, drove German bunds sharply lower and yields soaring up to 89bps. Speculators forced out of bunds where the ones buying the EUR that rose up to 1.1284 against its American rival, a fresh 2-week high. Short term, the upside remains favored as the price holds well above a bullish 20 SMA, whilst the RSI indicator has corrected extreme overbought readings and the Momentum indicator holds above 100. In the 4 hours chart, the technical indicators are losing upward strength in overbought levels, but so far, there are no technical signals the price may correct lower.
Support levels: 1.1240 1.1200 1.1160
Resistance levels: 1.1290 1.1330 1.1385
EUR/JPY Current price: 139.98
View Live Chart for the EUR/JPY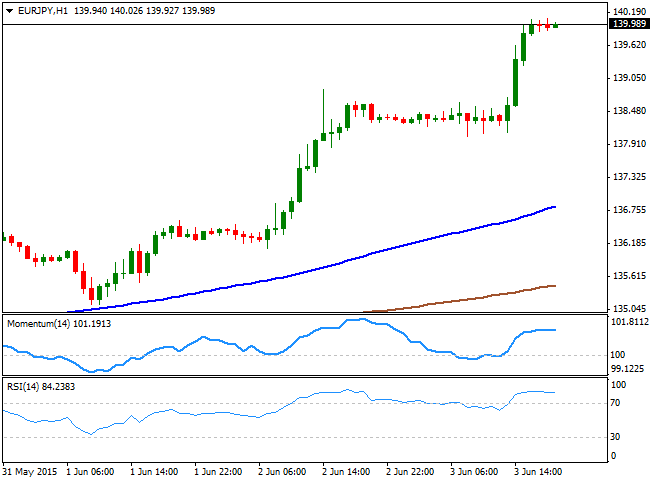
The EUR/JPY cross surged up to 140.08 on the back of EUR demand, a fresh 5-month high, and sits nearby by the end of the US session. The EUR/JPY 1 hour chart shows that the price extended far above its 100 SMA, currently around 136.80, whilst the technical indicators turned flat in extreme overbought levels, more reflecting the ongoing consolidation rather than suggesting the cross is exhausted towards the upside. In the 4 hours chart the technical picture is quite alike, with the technical indicators losing upward strength in extreme overbought levels, but far from signaling a downward move. The EUR/JPY has added almost 500 pips this pips, which means a downward corrective movement can't be dismissed. Nevertheless, a price acceleration through the critical 140.00 figure should lead to additional advances ahead of Friday's US employment figures release.
Support levels: 139.60 139.20 138.75
Resistance levels: 140.10 140.60 141.00
GBP/USD Current price: 1.5311
View Live Chart for the GBP/USD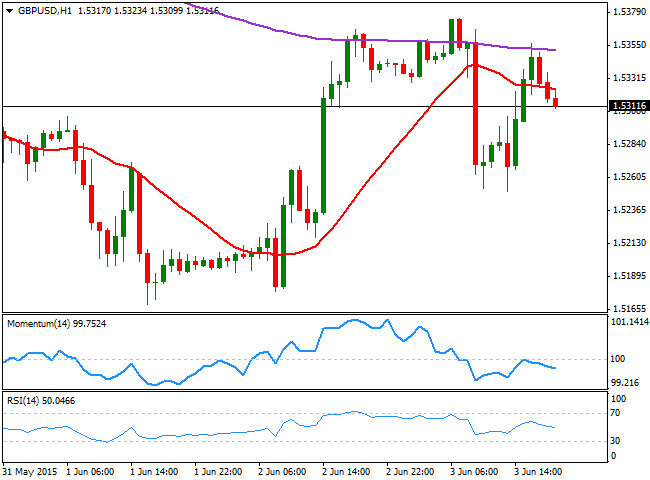
The British Pound fell to an intraday low of 1.5250 against the greenback early in the European session, on the back of a weaker-than-expected UK services PMI figure in May. The services sector printed a 5-month low of 56.5, suffering the sharpest decline in four years and raising concerns over the local economic recovery, ahead of BOE's meeting this Thursday. The GBP/USD pair surged, however, up to a daily high of 1.5357, before finally closing the day around the 1.5300 figure. The short term technical picture continues to favor the downside, as the price is developing below a mild bearish 20 SMA, whilst the technical indicators head south below their mid-lines, after failing to overcome them earlier in the day. In the 4 hours chart the price post a short-lived spike above its 200 EMA, but closed below it, whilst the Momentum indicator aims higher above 100. In this last time frame, the RSI indicator has already turned lower around 50, supporting the shorter term view and limiting the upside.
Support levels: 1.5260 1.5225 1.5170
Resistance levels: 1.5300 1.5330 1.5365
USD/JPY Current price: 124.35
View Live Chart for the USD/JPY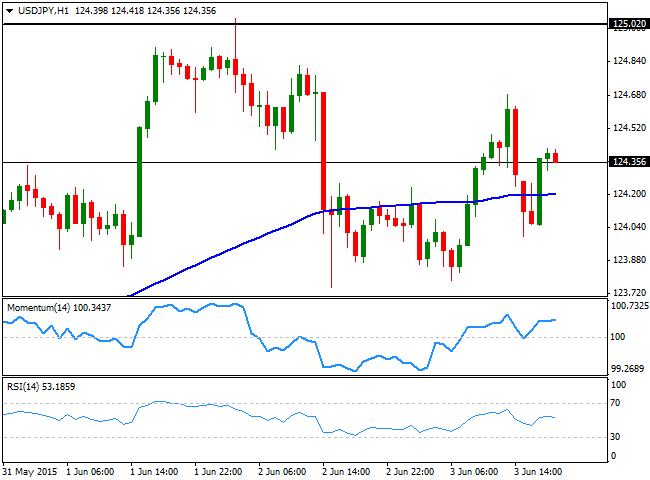
The USD/JPY pair showed little progress this Wednesday, having remained trapped within its early week range. The pair fell down to 123.78 early Asia, from where it recovered up to 124.68 the daily high. The pair fell back below the 124.00 figure on the back of tepid US data, but buyers once again surged on the dip, sending the pair back to the green. The 1 hour chart shows that the price is above a horizontal 100 SMA, whilst the technical indicators are holding above their mid-lines, but lacking directional strength at the time being. In the 4 hours chart, however, the technical indicators present a mild negative tone in neutral territory, which at least should limit the downside. Nevertheless, there is a good chance the pair will remain within familiar levels on Thursday, ahead of US Nonfarm Payroll employment report release on Friday, with only a clear break below 123.65 pointing for a stronger intraday decline towards the 123.00 level.
Support levels: 124.05 123.65 123.30
Resistance levels: 124.70 125.10 125.50
AUD/USD Current price: 0.7771
View Live Chart for the AUD/USD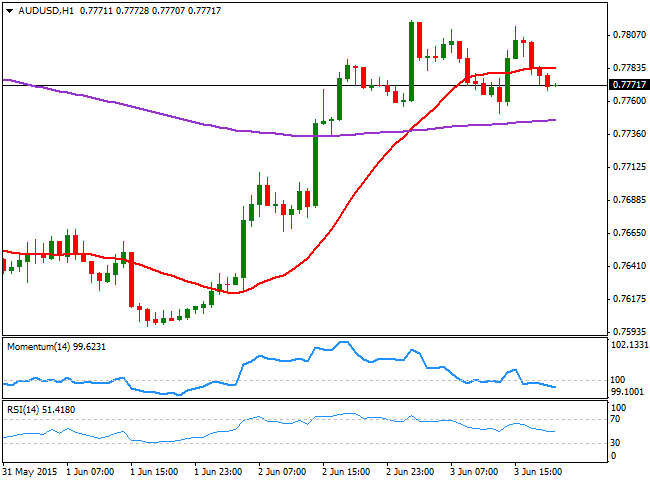
The AUD/USD pair has surged to a daily high of 0.7818, but gave up all of its intraday gains to close the day flat in the 0.7770 region. The daily candle presents a strong upward wick, and practically no body, suggesting an interim top may have been reached this week. Technically, the 1 hour chart shows that the price is back below its 20 SMA, now flat around 0.7790, whilst the technical indicators present a slight bearish tone below their mid-lines. In the 4 hours chart the price stalled around its 200 EMA around 0.7810, the critical resistance level to break to confirm additional recoveries. The Momentum indicator in the mentioned chart, presents a strong upward slope above the 100 level, whilst the 20 SMA also heads north below the current price, and the RSI indicator hovers around 57, all of which should support an advance, particularly if the price breaks above the mentioned 200 EMA.
Support levels: 0.7740 0.7700 0.7655
Resistance levels: 0.7810 0.7845 0.7890
Recommended Content
Editors’ Picks
USD/JPY briefly recaptures 160.00, then pulls back sharply

Having briefly recaptured 160.00, USD/JPY pulls back sharply toward 159.00 on potential Japanese FX intervention risks. The Yen tumbles amid news that Japan's PM lost 3 key seats in the by-election. Holiday-thinned trading exaggerates the USD/JPY price action.
AUD/USD extends gains above 0.6550 on risk flows, hawkish RBA expectations

AUD/USD extends gains above 0.6550 in the Asian session on Monday. The Aussie pair is underpinned by increased bets of an RBA rate hike at its May policy meeting after the previous week's hot Australian CPI data. Risk flows also power the pair's upside.
Gold stays weak below $2,350 amid risk-on mood, firmer USD

Gold price trades on a softer note below $2,350 early Monday. The recent US economic data showed that US inflationary pressures stayed firm, supporting the US Dollar at the expense of Gold price. The upbeat mood also adds to the weight on the bright metal.
Ethereum fees drops to lowest level since October, ETH sustains above $3,200

Ethereum’s high transaction fees has been a sticky issue for the blockchain in the past. This led to Layer 2 chains and scaling solutions developing alternatives for users looking to transact at a lower cost.
Week ahead: Hawkish risk as Fed and NFP on tap, Eurozone data eyed too

Fed meets on Wednesday as US inflation stays elevated. Will Friday’s jobs report bring relief or more angst for the markets? Eurozone flash GDP and CPI numbers in focus for the Euro.