EUR/USD Current price: 1.0890
View Live Chart for the EUR/USD

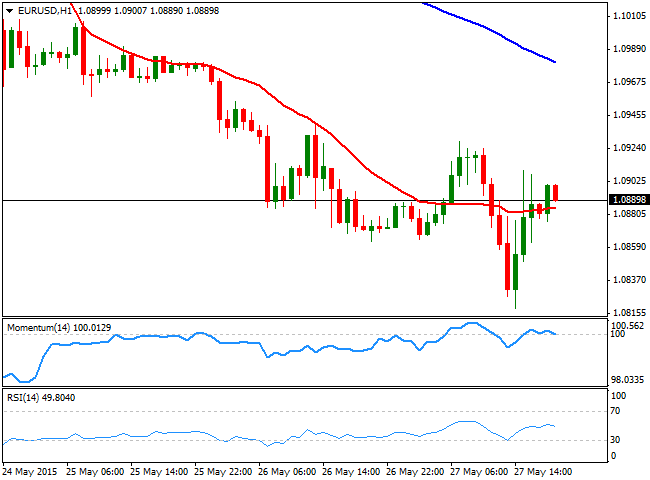
The dollar ended the day generally higher across the board, except against the EUR that erased all of intraday losses against its American rivals on hopes of a Greek deal. At the beginning of the day, the common currency fell down to a fresh monthly low of 1.0818, as broad dollar strength dominated in a light-calendar journey, and concerns over the peripheral country, after the ECB was said to keep the Greek ELA ceiling unchanged at €80.2bn this week. But mid American session, headlines coming from Greece stating that the country and its creditors have started crafting a staff level accord, triggered a strong comeback up to 1.0910 in the EUR/USD. During the rest of the American afternoon, EU authorities have been pouring cold water over the news, saying that they are just starting to work on it and that a deal by June 5th is unlikely.
The EUR/USD pair anyway held to its latest gains and closed the day a few pips below the 1.0900 level, maintaining the dominant bearish tone according to intraday charts, as the 1 hour one shows that the price hovers around a horizontal 20 SMA, whilst the technical indicators are turning south around their mid-lines, after correcting oversold readings. In the 4 hours chart the latest recovery stalled well below a bearish 20 SMA, currently around 1.0930 and the immediate intraday resistance, whilst the RSI indicator stands around 34 and the Momentum indicator below the 100 level, none with enough upward strength to support an upward continuation for the upcoming hours. Should the price retreat below the 1.0850, the pair will likely resume its decline, looking for fresh lows below the 1.0765 level.
Support levels: 1.0850 1.0810 1.0765
Resistance levels: 1.0930 1.0960 1.1000
EUR/JPY Current price: 134.83
View Live Chart for the EUR/JPY
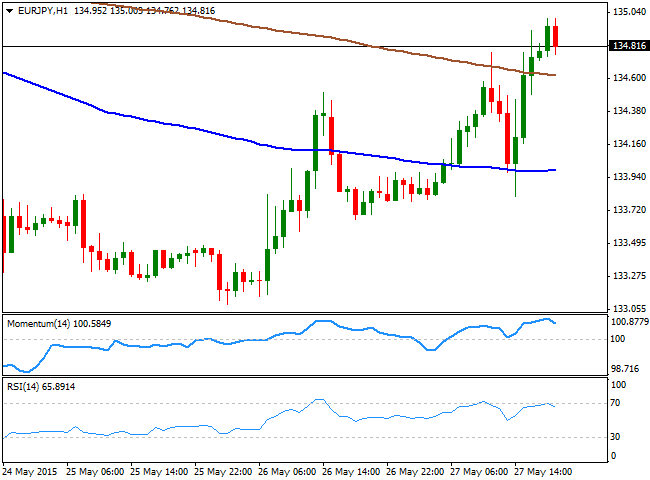
The EUR/JPY cross surged sharply on Greece deal's news, adding 100 pips intraday as the Japanese Yen extended its decline against all of its major rivals, boosted by a recovery in stocks. The EUR/JPY 1 hour chart shows that the price is now consolidating above its 100 and 200 SMAs, although the technical indicators are turning lower in overbought readings, suggesting the pair may correct lower during the upcoming hours. In the 4 hours chart however, the technical indicators maintain their bullish slopes above their mid-lines, whilst the price hovers around its 100 SMA, still unable to clearly break above it. Having posted a daily high of 135.00, renewed buying interest beyond the level should signal a continued advance for this Thursday, as long as the 134.50 contains the pair on retracements.
Support levels: 133.60 132.10 132.60
Resistance levels: 134.10 134.50 135.00
GBP/USD Current price: 1.5329
View Live Chart for the GBP/USD
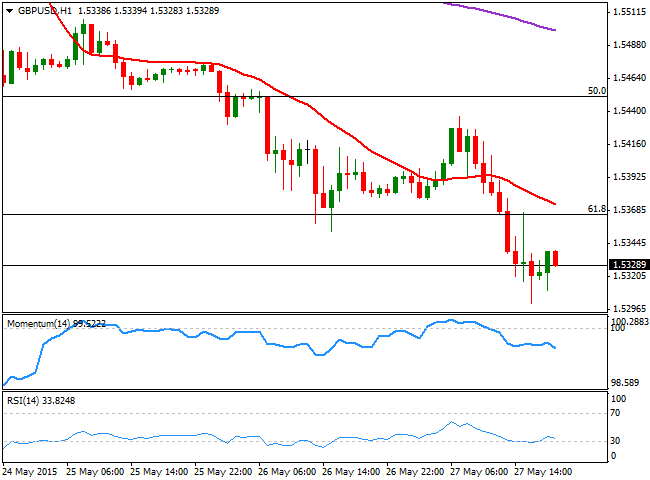
The GBP/USD pair has fallen down to a fresh 3-week low of 1.5300, as Greek ups and downs were not enough to halt dollar's rally. There were no relevant fundamental releases in the UK, but on Thursday, Britain will release a GDP revision for the first quarter of 2015, expected at 0.4% against a preliminary reading of 0.3%, alongside with some minor data on housing prices and business investment. If the GDP figures resulted above current expectations the Pound may recover some of its shine against the greenback. Nevertheless, the technical picture favors the downside, as the price has broken below the 61.8% retracement of the 1.5088/1.5814 rally at 1.5365, now a critical resistance level. In the 1 hour chart, the 20 SMA presents a strong bearish slope a few pips above the mentioned Fibonacci level, whilst the technical indicators continue to head south well into negative territory. In the 4 hours chart, the price is consolidating a few pips below the 200 EMA, and further declines are needed to confirm a bearish continuation, whilst the 20 SMA maintains a strong bearish slope well above the current price and the technical indicators are hovering in negative territory, lacking clear directional strength at the time being.
Support levels: 1.5305 1.5260 1.5220
Resistance levels: 1.5365 1.5400 1.5440
USD/JPY Current price: 123.87
View Live Chart for the USD/JPY
The USD/JPY pair reached a fresh 8-year high of 124.06 in the American afternoon, extending its advance, despite being extremely overbought in intraday time frames. Nevertheless, the pair is still biased higher, as the market has been eyeing the 125.00 level ever since the beginning of this 2015. Technically, the 1 hour chart shows that the 100 and 200 SMAs are gaining bullish slopes well below the current price, whilst the Momentum indicator remains well into positive territory and the RSI indicator aims higher around 73. In the 4 hours chart, the RSI indicator stands at 85, whilst the Momentum indicator is also at extreme overbought levels, and the moving averages hover around 400 pips below the current price, all of which reflects the ongoing upward strength, and support additional advances, particularly on a break above the mentioned daily high.
Support levels: 123.65 123.30 123.00
Resistance levels: 124.05 124.40 124.85
AUD/USD Current price: 0.7724
View Live Chart for the AUD/USD
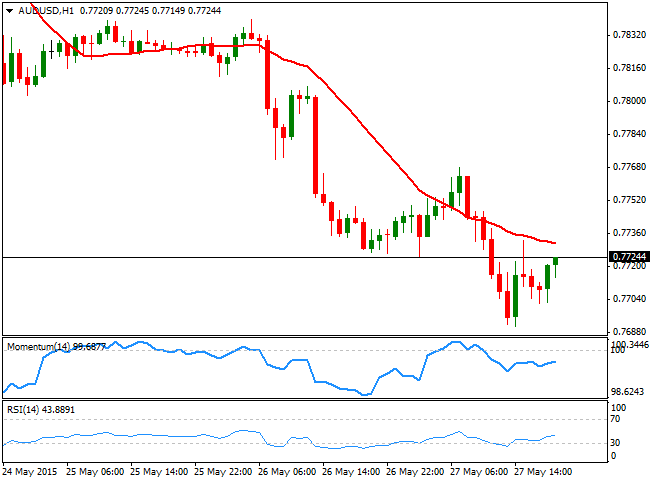
The AUD/USD pair fell down to a fresh 5-week low of 0.7690, but bounced back above the 0.7700 level, more on downside exhaustion rather than in a change in the bearish sentiment towards the pair. The catalyst for the latest decline was US Durable Goods Order reading, slightly above expected, but for the most, the generalized optimism over an upcoming rate hike in the US was the main reason of dollar's advance across the board. As for the technical picture for the AUD/USD, the 1 hour chart shows that the price holds below a bearish 20 SMA, whilst the Momentum indicator is turning south in negative territory, and the RSI indicator hovering around 42. In the 4 hours chart, the technical indicators have turned flat near oversold readings and lack directional strength, whilst the 20 SMA heads lower in the 0.7780 price zone, providing a strong dynamic resistance if the price manages to correct higher.
Support levels: 0.7670 0.7635 0.7600
Resistance levels: 0.7735 0.7780 0.7825
Recommended Content
Editors’ Picks
EUR/USD holds above 1.0750 to start the week

EUR/USD trades in positive territory above 1.0750 in the European session on Monday. The US Dollar struggles to find demand following Friday's disappointing labor market data and helps the pair hold its ground.
GBP/USD edges higher toward 1.2600

Following Friday's volatile action, GBP/USD pushes higher toward 1.2600 on Monday. Soft April jobs report from the US and the modest improvement seen in risk mood make it difficult for the US Dollar to gather strength.
Gold rebounds above $2,310 after downbeat NFP data, eyes on Fedspeak

Gold price trades in positive territory above $2,310 after closing the previous week in the red. The weaker-than-expected US employment data have boosted the odds of a September Fed rate cut, hurting the USD and helping XAU/USD find support.
Addressing the crypto investor dilemma: To invest or not? Premium

Bitcoin price trades around $63,000 with no directional bias. The consolidation has pushed crypto investors into a state of uncertainty. Investors can expect a bullish directional bias above $70,000 and a bearish one below $50,000.
Week ahead: BoE and RBA decisions headline a calm week

Bank of England meets on Thursday, unlikely to signal rate cuts. Reserve Bank of Australia could maintain a higher-for-longer stance. Elsewhere, Bank of Japan releases summary of opinions.