EUR/USD Current price: 1.0982
View Live Chart for the EUR/USD
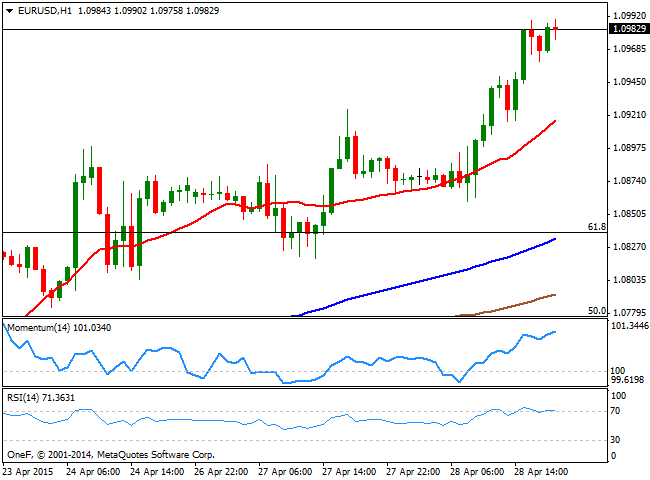
The EUR/USD rose to a fresh 3-week high of 1.0990 as the market decided to dump the greenback this Tuesday, amid renewed hopes Greece will avoid default. Fears that the country will be forced out of the Euro area eased after Greek PM Tsipras revamped the country's negotiation team late Monday, keeping the EUR on demand for most of the Asian session. As the day went by, the trigger for further dollar selling was another round of US negative data, as Consumer Confidence for April surprise to the downside, printing 95.2 from an expected 102.5, whilst the Richmond Manufacturing index, also for April, dropped below expected, to -3. Investors are now waiting for the first estimate of US Q1 GDP and the Fed’s Monetary Policy Statement on Wednesday. GDP is expected to come out at 1.0%, reflecting the weak readings seen over the first months of the year, whilst the FED is expected to keep its economic policy unchanged, and offer a dovish stance, all of which weighed on investor's sentiment.
Technically, the 1 hour chart shows that the price consolidates near the mentioned high, with the 20 SMA heading strongly higher in the 1.0920 region, and that the technical indicators are giving some signs of exhaustion in overbought territory. In the 4 hours chart the 20 SMA maintains a bullish slope, whilst the Momentum indicator turned lower above 100 and the RSI indicator hovers around 71, all of which suggest the pair may consolidate or correct lower, before aiming to extend its advance beyond the 1.1000 level.
Support levels: 1.0950 1.0910 1.0860
Resistance levels: 1.1000 1.1040 1.1085
EUR/JPY Current price: 130.45
View Live Chart for the EUR/JPY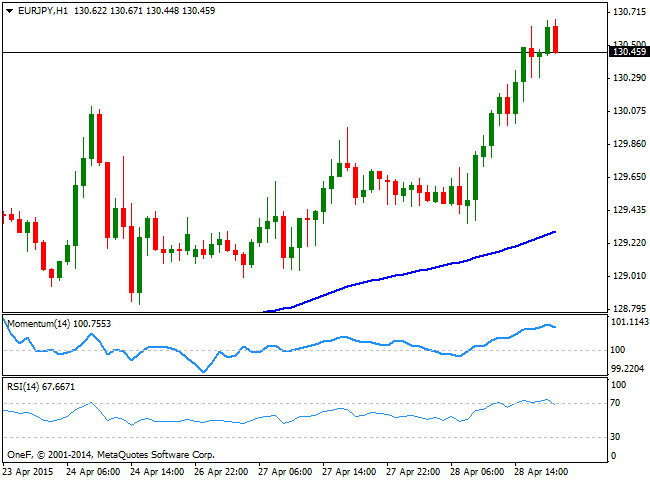
The EUR/JPY was dragged higher by the EUR upward momentum, breaking through the 130.00 figure during the American afternoon, and extending its advance to a fresh 3-week high of 130.67. The 1 hour chart shows that the price stands well above its moving averages, with the 100 and 200 SMAs gaining bullish slope well below the current level, and the technical indicators starting to ease in overbought territory, but far from signaling a downward extension at the time being. In the 4 hours chart the technical indicators are losing upward strength, but remain flat well above their mid-lines, something that at least should keep the downside limited during the upcoming hours.
Support levels: 130.10 129.70 129.30
Resistance levels: 130.70 131.10 131.60
GBP/USD Current price: 1.5334
View Live Chart for the GBP/USD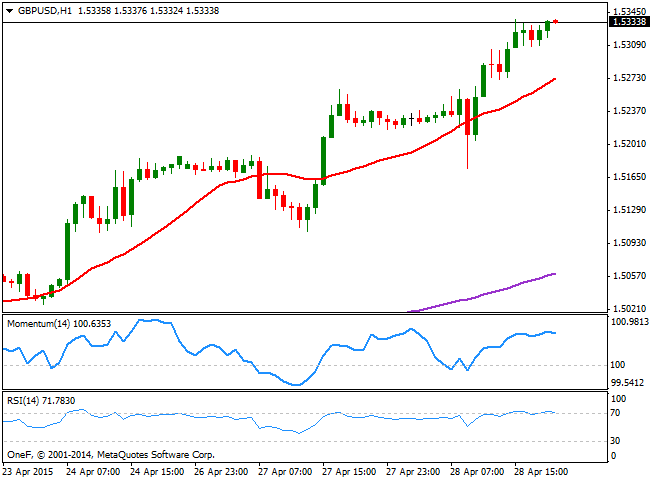
The GBP/USD pair trades at a fresh 8-week high, having managed to ignore a poor GDP reading in the UK. Britain's economy slowed more than expected the first three months of 2015, as according to data, the GDP grew by 0.3%in the first quarter of this year, compared with the last three months of 2014 when quarterly growth was 0.6%. The initial reaction to the news sent the pair to a low of 1.5176, albeit weaker-than-expected US data and upcoming economic events in the country pushed the pair back up. The 1 hour chart shows that the price consolidates near the highs, with the 20 SMA heading higher currently around 1.5260, whilst the technical indicators are turning lower in overbought territory. In the 4 hours chart the Momentum indicator is turning lower well above its mid-line, whilst the RSI remains at 77 as the 20 SMA heads higher well below the current level, maintaining the bullish bias alive, and with eyes now in the 1.5500 level.
Support levels: 1.5300 1.5260 1.5220
Resistance levels: 1.5340 1.5385 1.5415
USD/JPY Current price: 118.85
View Live Chart for the USD/JPY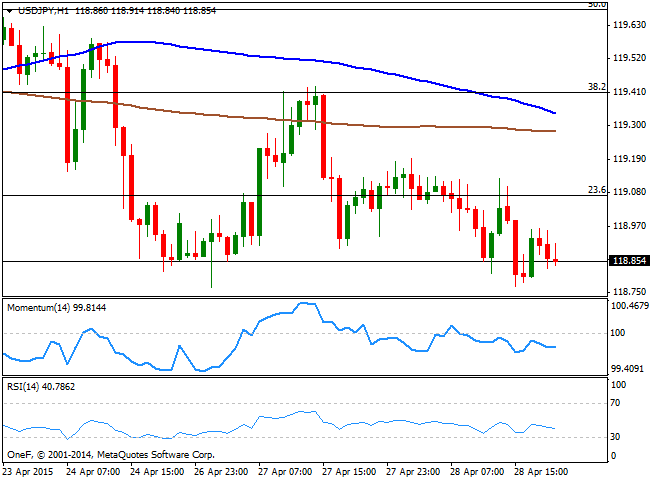
The USD/JPY pair continues to trade lower in range, confined below the 119.00 figure. Japan will be on holiday this Wednesday, so no macroeconomic data will be release over the upcoming hours. Nevertheless, the pair is likely set to react sharply to US upcoming data, particularly considering the wait and see stance going on in the pair. Short term, the bias is lower as in the 1 hour chart, the price extended further below its 100 and 200 SMAs, with the shortest approaching to cross the largest towards the downside in the 119.30 region, anticipating additional declines. Technical indicators in the mentioned time frame, maintain a bearish slope below their mid-lines, whilst in the 4 hours chart the technical indicators remain directionless below their mid-lines. In this last time frame, the pair has been unable to establish above the 23.6% retracement of its latest bearish run around 119.10, which increases chances of a downward continuation. Nevertheless, as commented on previous updates, the pair needs to break below 118.52, this month low, to confirm a new leg south.
Support levels: 118.50 118.10 117.70
Resistance levels: 119.10 119.50 120.00
AUD/USD Current price: 0.8009
View Live Chart for the AUD/USD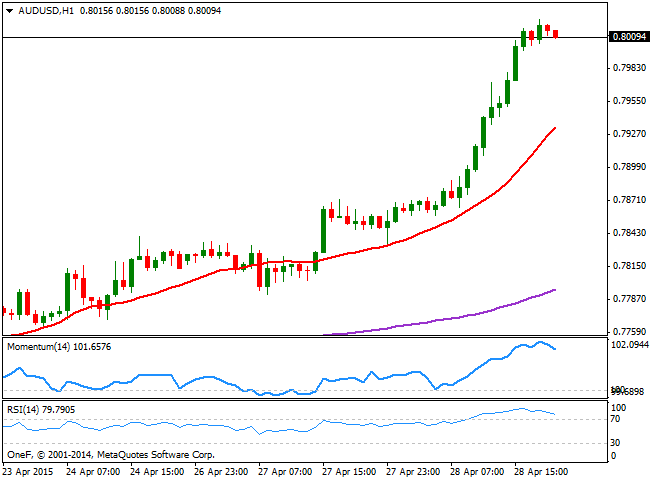
The AUD/USD pair surged to a 3-month high of 0.8024 on the back of dollar sell-off, as the commodity currency found support in surging metals, with gold adding another $15 to the upside, and iron-ore up nearly 1% to $59.2 extending its bounce from record lows. The 1 hour chart shows that the pair stands above 0.8000 with the technical indicators retracing partially but still in extreme overbought territory. In the same chart, the 20 SMA heads higher well below the current price, unable to catch up with the strong upward momentum of price. In the 4 hours chart, the technical indicators are also losing upward strength in extreme overbought territory, with the RSI indicator still around 77, which limits for now the possibility of a downward corrective movement. Additional advances above the 0.8030 level, the immediate resistance, should lead to a new leg higher, eyeing now and advance up to the 0.8100 figure.
Support levels: 0.7990 0.7940 0.7900
Resistance levels: 0.8030 0.8065 0.8100
Recommended Content
Editors’ Picks
AUD/USD gains momentum above 0.6500 ahead of Australian Retail Sales data

AUD/USD trades in positive territory for six consecutive days around 0.6535 during the early Asian session on Monday. The upward momentum of the pair is bolstered by the hawkish stance from the Reserve Bank of Australia after the recent release of Consumer Price Index inflation data last week.
EUR/USD: Federal Reserve and Nonfarm Payrolls spell action this week

The EUR/USD pair temporarily reconquered the 1.0700 threshold last week, settling at around that round level. The US Dollar lost its appeal following discouraging United States macroeconomic data indicating tepid growth and persistent inflationary pressures.
Gold: Strength of $2,300 support is an encouraging sign for bulls

Gold price started last week under heavy bearish pressure and registered its largest one-day loss of the year on Monday. The pair managed to stage a rebound in the second half of the week but closed in negative territory.
Ethereum fees drops to lowest level since October, ETH sustains above $3,200

Ethereum’s high transaction fees has been a sticky issue for the blockchain in the past. This led to Layer 2 chains and scaling solutions developing alternatives for users looking to transact at a lower cost.
Week ahead – Hawkish risk as Fed and NFP on tap, Eurozone data eyed too

Fed meets on Wednesday as US inflation stays elevated. Will Friday’s jobs report bring relief or more angst for the markets? Eurozone flash GDP and CPI numbers in focus for the Euro.