EUR/USD Current price: 1.0601
View Live Chart for the EUR/USD
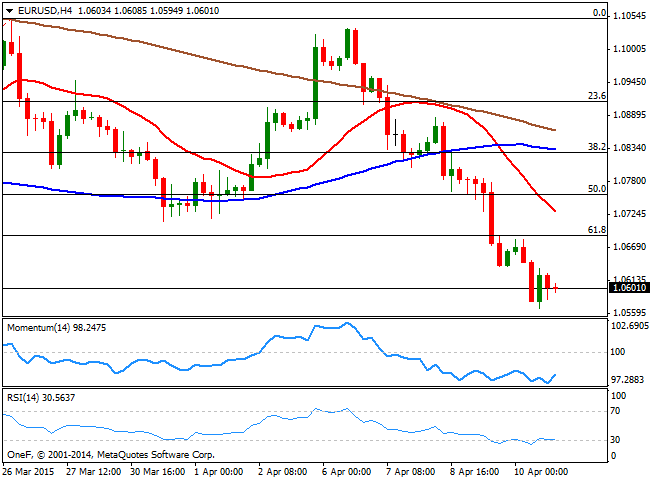
The dollar closed the week with a strong tone against most of its rivals, backed up by the release of FOMC Minutes, revealing that FED's officer have been split on whether to rise or not rates in June. The constant drama in between Greece and the other members of the EU, alongside with the stimulus launched by the ECB did the rest, tearing apart the EUR/USD pair that erased most of its past 3-week gains. The ECB is having is next monetary policy meeting this week, although due to their preference to "wait and see" and considering they launched QE in the previous meeting, is quite likely to be a non event for the financial markets.
In the meantime, the technical picture favors the downside, as the pair has broken below the 61.8% retracement of its latest bullish run, now quite a strong static resistance level around 1.0690. The 4 hours chart shows that the 20 SMA extended further below the largest moving averages, and maintains a strong bearish slope well above the current level, whilst the technical indicators are hovering in oversold levels, with no signs the pair may attempt to correct higher. The immediate support stands at 1.0550, where the pair has set several intraday highs and lows at the beginning of March, which means a break below it is required to confirm additional declines towards the year low of 1.0461.
Support levels: 1.0550 1.0510 1.0460
Resistance levels: 1.0640 1.0680 1.0715
EUR/JPY Current price: 128.43
View Live Chart for the EUR/JPY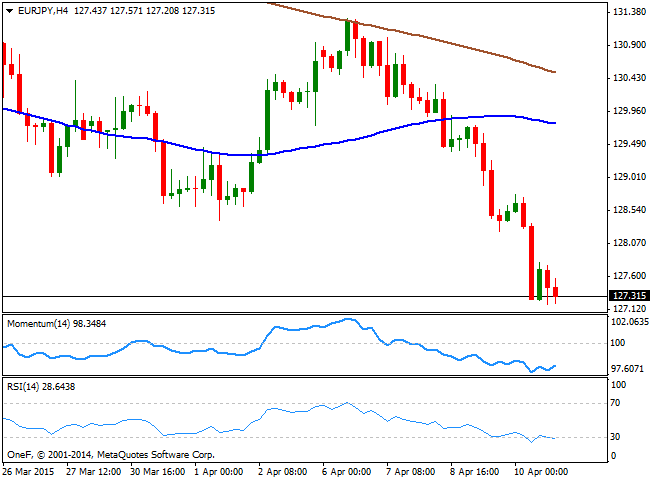
With the Japanese yen refusing to give up to dollar's strength, the EUR/JPY ended the week with a strong bearish tone, a handful of pips above the year low established in March at 126.89. The Bank of Japan has left its monetary policy unchanged last week, despite some rumors the BOJ may consider to add additional stimulus to the depressed economy, something that ended up favoring the local currency. Technically, the pair maintains its bearish tone, with the 4 hours chart showing that the price extended below its moving average, while the Momentum indicator aims to recover well below the 100 level, and the RSI indicator maintains its bearish slope around 28, signaling further declines, particularly if the 126.89 gives up, with scope then to extend the decline towards the 124.00 area next week.
Support levels: 126.90 126.50 126.10
Resistance levels: 127.65 128.00 128.40
GBP/USD Current price: 1.4615
View Live Chart for the GBP/USD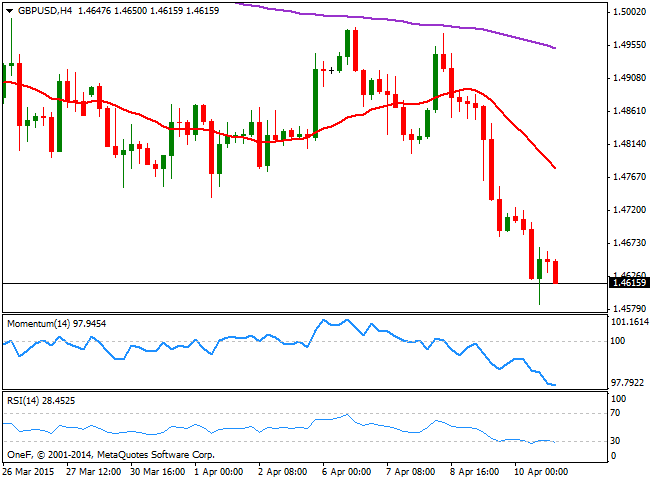
The GBP/USD pair closed last week at its lowest level in almost five years, having set a low at 1.4586 late Friday and holding around it by the close. The British Pound was weighted by weaker-than-expected manufacturing readings, alongside with the prospect of a hung parliament as a result of upcoming May elections. The upcoming week will bring employment and inflation figures in the UK and it those result weak, the pair could extend its decline beyond the critical 1.4500 level. Technically, the 4 hours chart shows that the price extended further below a bearish 20 SMA after failing around its 200 EMA earlier in the week, whilst the technical indicators maintain a strong bearish slope, despite in oversold levels, all of which maintains the risk towards the downside. A downward acceleration below the mentioned low, should signal a downward continuation this Monday, eyeing the 1.4500 as the main bearish target.
Support levels: 1.4585 1.4550 1.4510
Resistance levels: 1.4635 1.4680 1.4725
USD/JPY Current price: 120.12
View Live Chart for the USD/JPY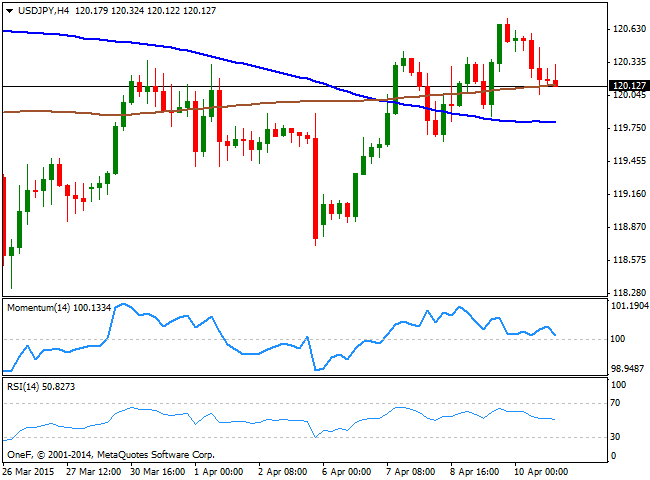
Despite dollar's strength, the USD/JPY pair was unable to advance strongly above the 120.00 region, still confined to range around the mark. Nevertheless, the pair presents a mild positive tone having set higher highs daily basis, with strong buying interest aligned around 119.00. Short term, the technical picture shows that the price eased from its highs in the 120.80 region, standing now a few pips above a bullish 20 SMA and with the 200 SMA offering support around 119.80. The indicators in the same time frame head lower below their mid-lines, anticipating some additional declines. In the 4 hours chart the price struggles around a flat 200 SMA, while the technical indicators have turned lower, but remain above their mid-lines. A break below the mentioned 119.80 level may lead to additional declines albeit buying the dips against 118.71, this month low, seems to be the way to play it this week.
Support levels: 119.70 119.35 118.95
Resistance levels: 120.45 120.85 121.30
AUD/USD Current price: 0.7672
View Live Chart for the AUD/USD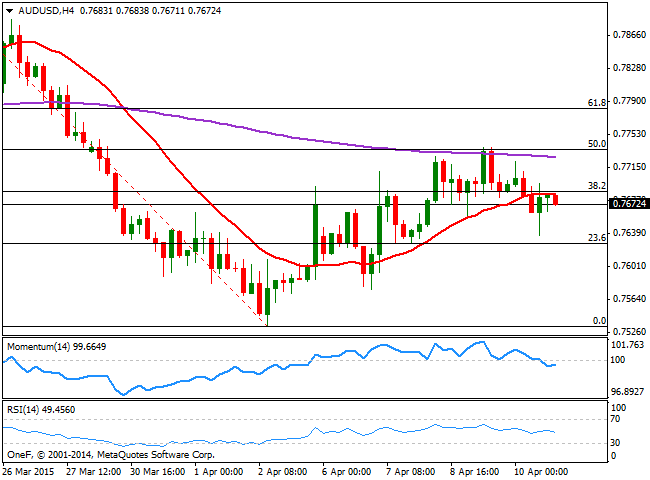
The Australian dollar has fared well against dollar's momentum, finding support on RBA's decision to keep rates on hold for second month in a row. Nevertheless, the pair was rejected from the 50% retracement of its latest daily decline, and presents a mild bearish tone into the upcoming week. In these coming days, the pair will have to deal with local employment figures and the price of commodities, as the sharp decline in iron ore prices has limited the upside in the antipodean currency. Technically, the 1 hour chart shows that the price stands below the 38.2% retracement of the same rally around 0.7685 and a bearish 20 SMA, whilst the technical indicators have lost their upward potential and turned lower right below their mid-lines. In the 4 hours chart the 20 SMA converges with the mentioned Fibonacci level, while the technical indicators maintain a neutral stance around their mid-lines. Having been trading between Fibonacci levels, a break below the 23.6% retracement of the same rally at 0.7625 is required to confirm additional declines, whilst sellers will likely contain the pair in the 0.7705/0.7740 region.
Support levels: 0.7660 0.7625 0.7580
Resistance levels: 0.7705 0.7740 0.7785
Recommended Content
Editors’ Picks
EUR/USD remains above 1.0700 amid expectations of Fed refraining from further rate hikes

EUR/USD continues to gain ground on Thursday as the prevailing positive sentiment in the market provides support for risk-sensitive currencies like the Euro. This improved risk appetite could be attributed to dovish remarks from Federal Reserve Chairman Jerome Powell on Wednesday.
GBP/USD gains traction above 1.2500, Fed keeps rates steady

GBP/USD gains traction near 1.2535 during the early Thursday. The uptick of the major pair is supported by the sharp decline of the US Dollar after the US Federal Reserve left its interest rate unchanged.
Gold price struggles for a firm intraday direction, hover above $2,300

Gold price fails to lure buyers amid a fresh leg up in the US bond yields, modest USD uptick. A positive risk tone also contributes to capping the upside for the safe-haven precious metal. Traders, however, might prefer to wait for the US NFP report before placing aggressive bets.
Top 3 Price Prediction BTC, ETH, XRP: Altcoins to pump once BTC bottoms out, slow grind up for now

Bitcoin reclaiming above $59,200 would hint that BTC has already bottomed out, setting the tone for a run north. Ethereum holding above $2,900 keeps a bullish reversal pattern viable despite falling momentum. Ripple coils up for a move north as XRP bulls defend $0.5000.
Fed meeting: The hawkish pivot that never was, and the massive surge in the Yen

The Fed’s latest meeting is over, and the tone was more dovish than expected, but that is because the rate hike hype in the US was over-egged, and rate cut hopes had been pared back too far in recent weeks.