EUR/USD Current price: 1.0771
View Live Chart for the EUR/USD
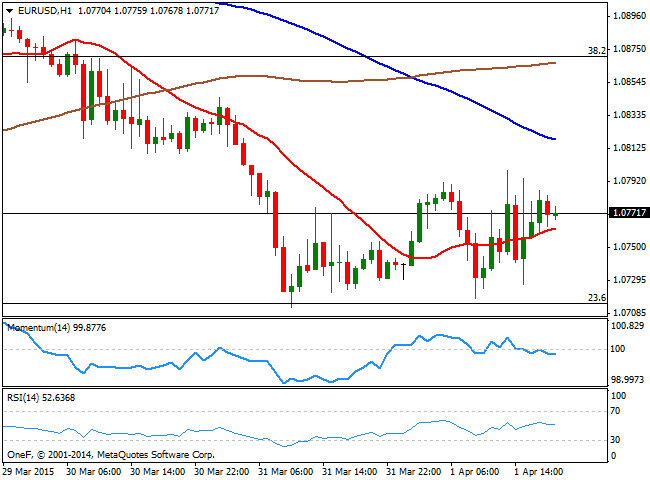
The EUR/USD traded in quite a choppy fashion this Wednesday, with the dollar generally higher earlier in the day, until a weak US ADP survey sent investors away from the greenback. In Europe, Markit Manufacturing PMI readings beat expectations, providing further sings the local economies are growing. Nevertheless, the EUR remained subdued after the release, as the lack of answer to the Greek debt issues scares investors away from the common currency. The pair trades as low as 1.0718 during the European session, jumping up to 1.0798 on the back of disappointing US employment data, as the ADP survey estimates the country added just 189K new jobs in March.
Technically, the pair has been pretty much range bound this week, in between 1.0710 and 1.0865, both Fibonacci levels, and will likely remain so ahead of the US Nonfarm Payroll release next Friday. Short term, the 1 hour chart shows that the price stands a few pips above a mild bullish 20 SMA, whilst the technical indicators maintain limited bearish in neutral territory. In the 4 hours chart the downside is favored, as the 20 SMA caps the upside around 1.0815, whilst the technical indicators aim higher below their mid-lines, mostly correcting oversold readings than suggesting further advances.
Support levels: 1.0760 1.0710 1.0660
Resistance levels: 1.0815 1.0865 1.0900
EUR/JPY Current price: 128.87
View Live Chart for the EUR/JPY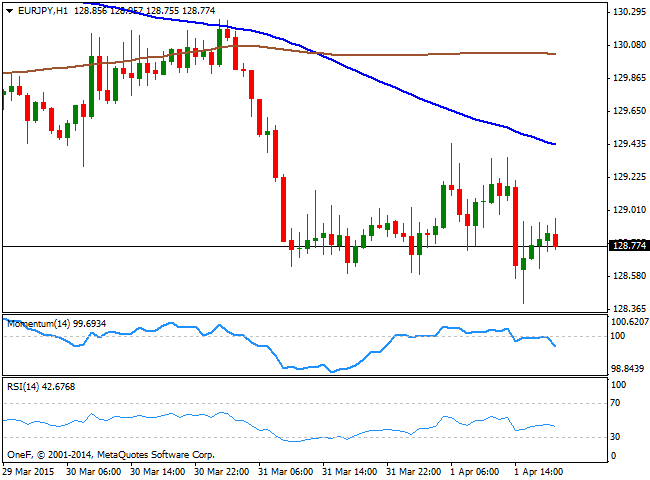
The Japanese yen strengthened further against the EUR, falling as low as 128.40 intraday, and unable to recover the 129.00 level afterwards. The downward potential in the pair has increased in the short term, as the 1 hour chart shows that the 100 SMA accelerated sharply below the 200 SMA, with the shortest now offering dynamic resistance in the 129.40 region, and the technical indicators head lower below their mid-lines. In the 4 hours chart the pair found sellers around a bearish 100 SMA, whilst the technical indicators remain directionless in negative territory. Having been unable to regain the 130.0 level, the downside is favored in the mid-term, although there is quite usual to see JPY crosses ranging one day before US employment data, and waiting for the report before setting its directional strength.
Support levels: 129.75 129.30 128.80
Resistance levels: 130.35 130.80 131.20
GBP/USD Current price: 1.4830
View Live Chart for the GBP/USD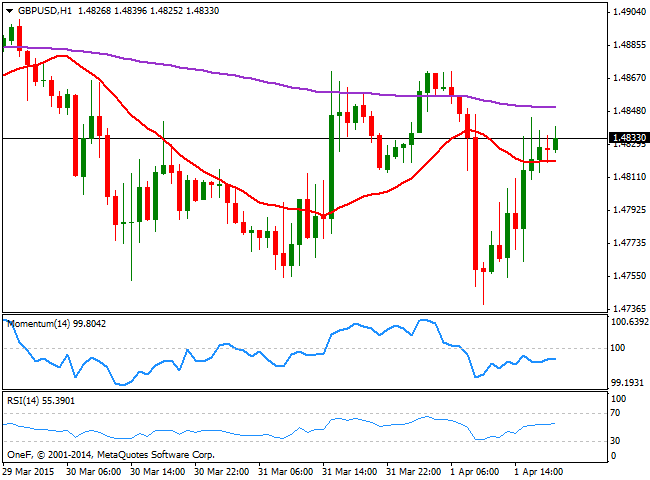
Having established a lower low for the week at 1.4739, the GBP/USD pair bounced strongly back, retaking the 1.4800 level. In the UK, Markit Manufacturing PMI hit an 8-month high of 54.4 in March, resulting in two years of steady growth in the United Kingdom, although the pair needed tepid US macroeconomic figures to change course. From a technical point of view, the upside remains limited, as the 1 hour chart shows that the price consolidates a few pips above a flat 20 SMA, albeit the technical indicators are flat below their mid-lines. In the 4 hours chart the price struggles around its 20 SMA that presents a tepid bearish slope, whilst the technical indicators hover in neutral territory, with the RSI still below 50. In the same chart, the pair is developing inside a short term descendant channel, with the roof in the 1.4850/60 area for the upcoming hours. The pair needs to accelerate above this area to be able to extend its gains, eyeing then an advance up to the 1.4920 price zone.
Support levels: 1.4790 1.4750 1.4710
Resistance levels: 1.4860 1.4900 1.4925
USD/JPY Current price: 119.60
View Live Chart for the USD/JPY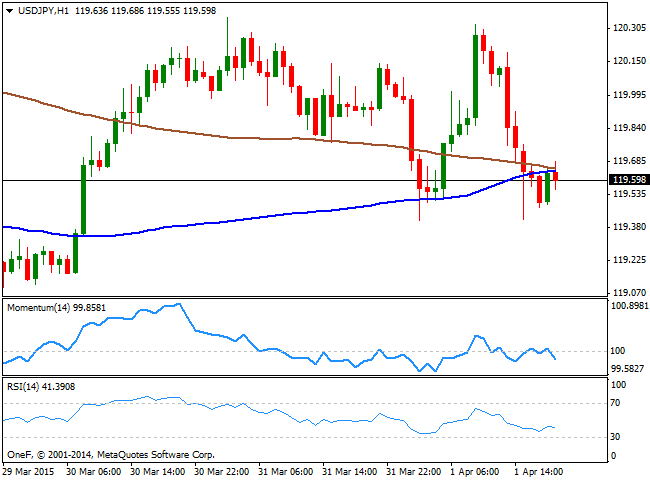
The USD/JPY retraced once again from the 120.35 level, the weekly high set on Tuesday, falling down to 119.41 during the American afternoon. Consolidating a few pips above the mentioned daily low, the 1 hour chart shows that the 100 and the 200 SMAs converge at 119.65, acting as a strong short term dynamic resistance, yet also reflecting the lack of directional strength the pair has. In the same chart, the technical indicators are flat below their mid-lines, lacking directional strength, but maintaining the risk towards the downside. In the 4 hours chart the Momentum indicator heads sharply south below its mid-line, whilst the RSI hovers around 47, supporting the shorter term view. The immediate support stands at 119.20, so a break below the level is what it takes to confirm a downward acceleration for the upcoming sessions, unlikely before Friday and US employment data.
Support levels: 119.20 118.80 118.50
Resistance levels: 119.65 120.10 120.45
AUD/USD Current price: 0.7598
View Live Chart for the AUD/USD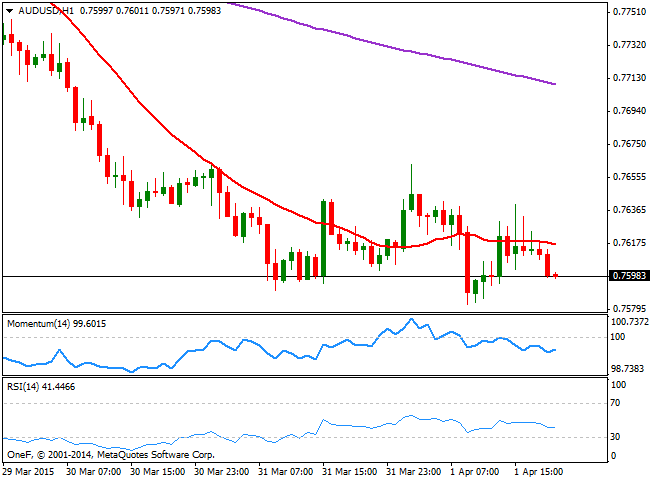
The Australian dollar trades below the 0.7600 level against the greenback, as the Aussie has lost its charm on speculation the RBA is preparing a rate cut for this month´s meeting. Later on in the Asian session, the country will release the Trade Balance figures for February, with the deficit expected to have widen to 1,300 millions, which should add further pressure into the antipodean currency. Technically, the 1 hour chart shows that the price remains below its 20 SMA, whilst the indicators are directionless in negative territory, as the pair has been contained in quite a limited intraday range. In the 4 hours chart the 20 SMA maintains a strong bearish slope, capping the upside around 0.7650 now, whilst the RSI indicator heads lower around 33. The Momentum indicator in this last time frame however, diverges to the upside, approaching its 100 level from below. Nevertheless, there are no other technical signs that the price may attempt to recovery during the upcoming hours, as only some steady advance beyond 0.7650 will help the pair to post additional advances towards the 0.7690 price zone.
Support levels: 0.7590 0.7555 0.7510
Resistance levels: 0.7620 0.7650 0.7690
Recommended Content
Editors’ Picks
AUD/USD: Extra gains in the pipeline above 0.6520

AUD/USD partially reversed Tuesday’s strong pullback and regained the 0.6500 barrier and beyond in response to the sharp post-FOMC pullback in the Greenback on Wednesday.
EUR/USD jitters post-Fed with NFP Friday over the horizon

EUR/USD cycled familiar territory on Wednesday after the US Federal Reserve held rates as many investors had expected. However, market participants were hoping for further signs of impending rate cuts from the US central bank.
Gold prices skyrocketed as Powell’s words boosted the yellow metal

Gold prices rallied sharply above the $2,300 milestone on Wednesday after the Federal Reserve kept rates unchanged while announcing that it would diminish the pace of the balance sheet reduction.
Ethereum plunges outside key range briefly as US Dollar Index gains strength

Institutional whales appear to be dumping Ethereum after recent dip. Fed’s decision to leave rates unchanged appears to have helped ETH's price recover slightly. SEC Chair Gensler has misled Congress, considering recent revelations from Consensys suit, says Congressman McHenry.
The FOMC whipsaw and more Yen intervention in focus

Market participants clung to every word uttered by Chair Powell as risk assets whipped around in a frenetic fashion during the afternoon US trading session.