EUR/USD Current price: 1.1117
View Live Chart for the EUR/USD

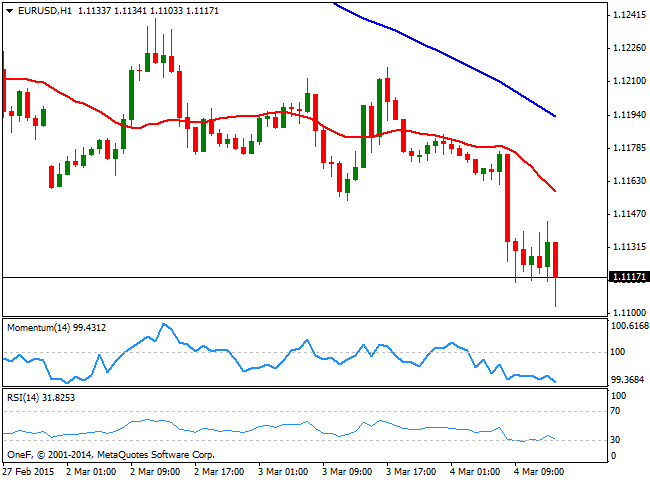
The EUR/USD pair traded as low as 1.1103 this Wednesday, weighed by worse than expected Services PMI in the Euro area, and looming ECB meeting this Thursday. The US ADP private survey said the country added 212K new jobs last February, slightly below the 220K expected, and with January reading reviewed to the upside, up to 250K. Early in the US session, the pair trades near the mentioned low, with 1.1150 capping the upside, and the 1 hour chart showing that the price holds below a bearish 20 SMA, whilst indicators turned flat after correcting oversold readings. In the 4 hours chart the bearish tone has lost downward momentum, but is far from signaling a change in the dominant bearish trend. The market may remain on hold ahead of tomorrow's ECB decision, furthermore considering the Central Bank is expected to shed light on the QE program expected to be launched as soon as next week.
Support levels: 1.1095 1.1050 1.1010
Resistance levels: 1.115 1.1180 1.1230
GBP/USD Current price: 1.5378
View Live Chart for the GBP/USD
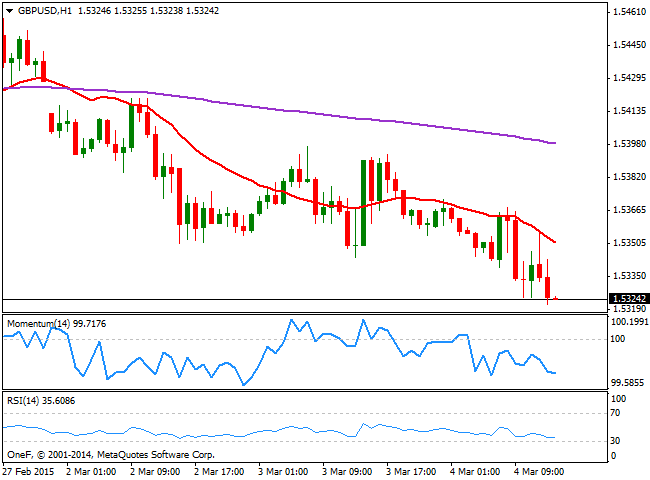
The GBP/USD pair trades near a three-week low of 1.5315 posted mid February, with a heavy bearish tone as per dollar broad strength against its European rivals. The 1 hour chart shows a strong bearish momentum coming from technical readings as the price extends further below a bearish 20 SMA whilst indicators accelerate lower below their midlines. In the 4 hours chart the price is sliding further below its 200 EMA, while the technical indicators gained bearish strength well below their midlines, supporting additional declines in the short term.
Support levels: 1.5315 1.5280 1.5250
Resistance levels: 1.5340 1.5385 1.5420
USD/JPY Current price: 119.55
View Live Chart for the USD/JPY
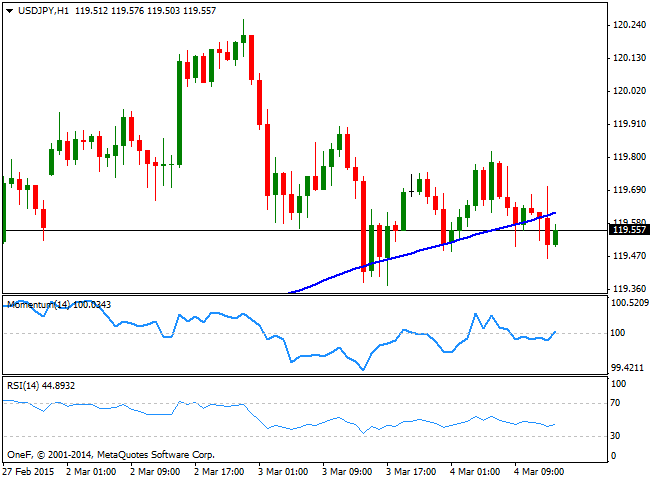
The USD/JPY pair continues to trade range bound, finding short term buyers around the 119.40 price zone. The 1 hour chart shows that the pair trades below its 100 SMA, while the technical indicators aim higher around their midlines, lacking directional strength at the time being. In the 4 hours chart the price holds well above its moving averages but the technical indicators head lower below their midlines, keeping the risk towards the downside. Nevertheless, the pair will likely continue to hold in range ahead of US monthly employment figures.
Support levels: 119.40 119.10 118.80
Resistance levels: 119.95 120.45 120.90
AUD/USD Current price: 0.7841
View Live Chart for the AUD/USD
The Australian dollar advanced up to 0.7859 against its American rival, with the pair maintaining its intraday gains. The 1 hour chart shows that the price holds above a flat 20 SMA while the technical indicators are turning south above their midlines. In the 4 hours chart the technical picture favors the upside as the indicators head higher above their midlines whilst the 20 SMA offers intraday support around 0.7800.
Support levels: 0.7800 0.7755 0.7720
Resistance levels: 0.7840 0.7890 0.7925
Recommended Content
Editors’ Picks
EUR/USD holds above 1.0750 to start the week

EUR/USD trades in positive territory above 1.0750 in the European session on Monday. The US Dollar struggles to find demand following Friday's disappointing labor market data and helps the pair hold its ground.
GBP/USD clings to small gains above 1.2550

Following Friday's volatile action, GBP/USD edges highs and trades in the green above 1.2550. Soft April jobs report from the US and the modest improvement seen in risk mood make it difficult for the US Dollar to gather strength.
Gold price rebounds on downbeat NFP data, eyes on Fedspeak

Gold price (XAU/USD) snaps the two-day losing streak during the European session on Monday. The weaker-than-expected US employment reports have boosted the odds of a September rate cut from the US Fed.
Addressing the crypto investor dilemma: To invest or not? Premium

Bitcoin price trades around $63,000 with no directional bias. The consolidation has pushed crypto investors into a state of uncertainty. Investors can expect a bullish directional bias above $70,000 and a bearish one below $50,000.
Week ahead: BoE and RBA decisions headline a calm week

Bank of England meets on Thursday, unlikely to signal rate cuts. Reserve Bank of Australia could maintain a higher-for-longer stance. Elsewhere, Bank of Japan releases summary of opinions.