Texas Instruments Inc.(TXN) Elliott Wave technical analysis [Video]
![Texas Instruments Inc.(TXN) Elliott Wave technical analysis [Video]](https://editorial.fxstreet.com/images/Markets/Equities/Industries/Semiconductors/pic-man-repairing-semiconductors-637435354060707899.jpg)
TXN Elliott Wave technical analysis
Function: Trend
Mode: Impulsive
Structure: Motive
Position: Minor 3
Direction: Upside in Minor 3.
Details: Looking for at least equality of 3 vs. 1 as upside target, to eventually turn into an ABC in the worst of scenarios.
TXN Elliott Wave technical analysis – Daily chart
The daily chart for TXN reveals that the stock is currently in an impulsive, motive wave pattern, identified as Minor wave 3. This suggests a strong upward trend, indicating potential for significant
gains. The analysis targets at least equality between wave 3 and wave 1, pointing towards a robust upside potential. In less favorable scenarios, this movement might evolve into an ABC correction pattern, but the primary expectation remains bullish.

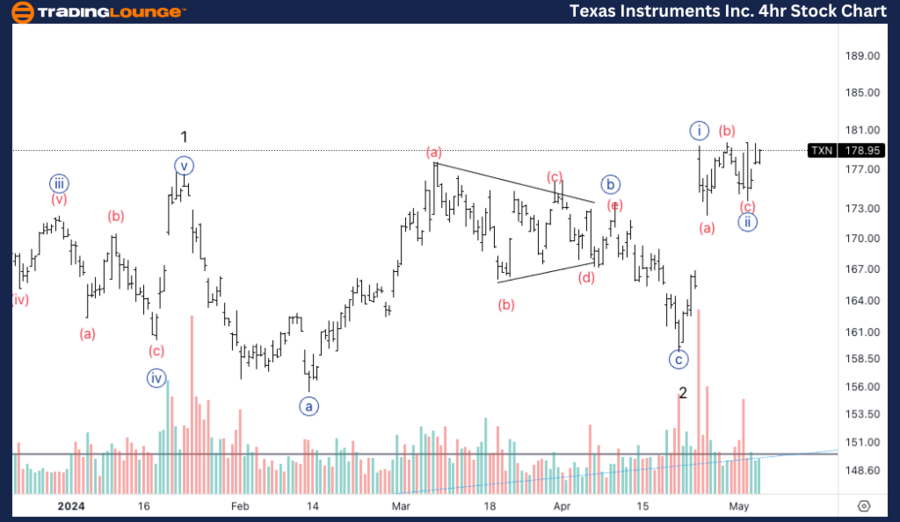
TXN Elliott Wave technical analysis
FUNCTION: Trend
MODE: Impulsive
STRUCTURE: Motive
POSITION: Wave {ii} of 3.
DIRECTION: Upside in {iii}.
DETAILS: Looking for acceleration in wave {iii}, with closing volume on Friday suggesting a bullish move to the upside.
TXN Elliott Wave technical analysis – Four-hour chart
Diving deeper into the 4-hour chart, TXN is positioned in Wave {ii} of Minor 3, forecasting an upcoming surge in Wave {iii}. The closing volume on the previous trading day (Friday) indicated a significant bullish sentiment, which aligns with expectations for an acceleration in Wave {iii}. This provides an excellent setup for traders looking to capitalize on the next upward move.
This detailed Elliott Wave analysis focuses on Texas Instruments Incorporated (TXN) as observed in both the daily and 4-hour charts on May 6, 2024. Our analysis aims to provide investors and traders with actionable insights into the stock’s current trends and potential future movements.
Texas Instruments Inc.(TXN) Elliott Wave technical analysis [Video]
Author

Peter Mathers
TradingLounge
Peter Mathers started actively trading in 1982. He began his career at Hoei and Shoin, a Japanese futures trading company.