EUR/USD Current price: 1.1274
View Live Chart for the EUR/USD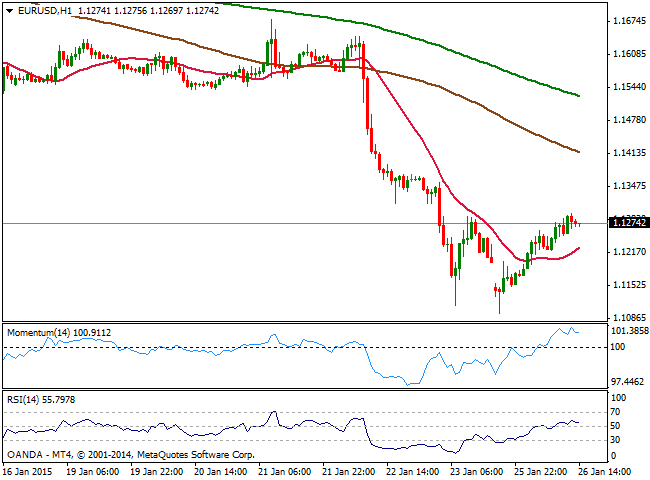
The EUR/USD pair traded in upward corrective mode this Monday, stalling a couple of pips shy of the 1.1300 level, after trading as low as 1.1097 past Asian session. Despite Greek far-left Syriza took over government and new PM Alexis Tsipras pledged to end five years of austerity and renegotiate Greece's debt agreements, markets were optimistic, with stocks rising and safe havens under pressure for most of the day. The macroeconomic calendar was pretty empty, exception made by German IFO survey that showed an improvement in local business climate. Tuesday however will have a good number of fundamental readings particularly coming from the US, set to imprint more life to the US session.
Technically, the EUR/USD pair presents a mild positive tone in the short term, as the 1 hour chart shows price hovering near the highs and above a slightly bullish 20 SMA, whilst indicators lost upward strength but remain in positive territory. In the 4 hours chart indicators continue to advance from extreme oversold levels, but remain well below their midlines, with RSI at 41, while 20 SMA offers strong dynamic resistance in the 1.1350/60 price zone. If this last level is reached, chances are of a strong selling interest surging, limiting the upside, whilst a break below 1.1200 will probably put the pair back under selling pressure.
Support levels: 1.1245 1.1200 1.1150
Resistance levels: 1.1325 1.1360 1.1400
EUR/JPY Current price: 133.55
View Live Chart for the EUR/JPY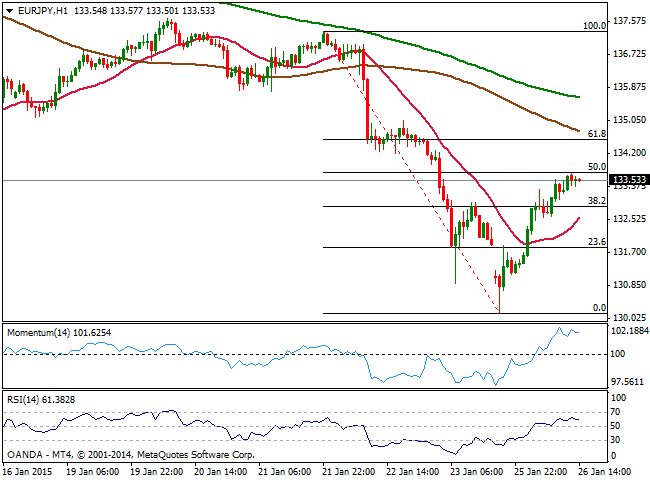
The Japanese yen was under pressure against all of its rivals in this first day of the week, with the EUR/JPY pair advancing almost 360 pips intraday after setting a fresh low of 130.14. The strong recovery in equities all over the world supported the rallies, with the EUR/JPY correcting by the pip 50% of its latest slide. The 1 hour chart shows indicators losing upward strength in positive territory, whilst 100 and 200 SMAs maintain strong bearish slopes well above current price. In the 4 hours chart indicators corrected oversold readings and continue to head north well below their midlines, suggesting further gains are likely if the pair breaks the immediate Fibonacci resistance at 133.70, aiming for a test of 134.55, 61.8% retracement of the same rally.
Support levels: 132.85 132.30 131.90
Resistance levels: 133.70 134.10 134.55
GBP/USD Current price: 1.5085
View Live Chart for the GBP/USD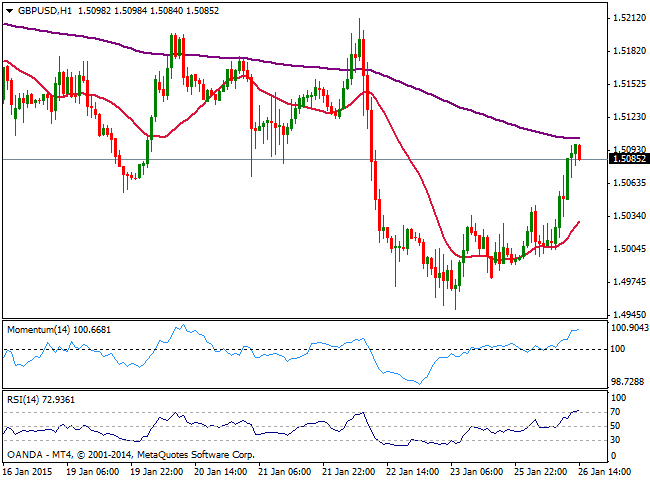
The GBP/USD pair surged up to 1.5099 fresh 3-days high before retracing some, closing the day however fairly higher. There was no fundamental data to drive the Pound higher, although early day weakness in EUR, pushing EUR/GBP to new multi-years lows, helped to support the pair above the 1.5000 figure. Up roaring stocks alongside with comments of Bank of England Kristen Forbes saying that she is optimistic on global growth and that falling oil prices may boost consumption worldwide, leading to an early rate hike in the UK, also supported the British currency. Technically, the 1 hour chart shows indicators getting exhausted to the upside in overbought territory, as 20 SMA turns higher well below current price, offering intraday support in the 1.5120 price zone. In the 4 hours chart price advanced and holds above its 20 SMA, whilst momentum aims higher below 100 and RSI crosses the 50 level to the upside, all of which favors further advances if the pair manages to pick up momentum above the 1.5120 price zone.
Support levels: 1.5055 1.5010 1.4950
Resistance levels: 1.5125 1.5160 1.5200
USD/JPY Current price: 118.47
View Live Chart for the USD/JPY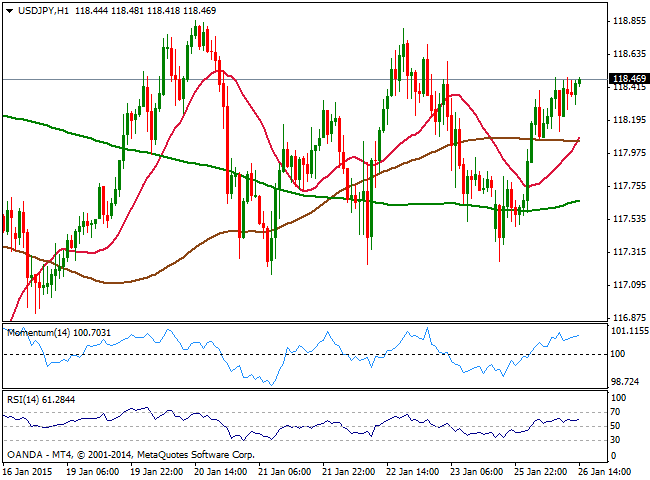
The USD/JPY recovered from an intraday low of 117.36, pressuring its daily highs near 118.50 by US close. During the past Asian session, BOJ’s Policy Board has published its latest minutes, in which by an 8-1 majority vote, voting members maintained the decision to conduct money market operations so that the monetary base will increase at an annual pace of about 80 trillion yen. Trade balance deficit shrunk as exports were stronger than expected, rising 12.9%y/y and imports slightly softer at 1.9%y/y. There will be no relevant data in Japan this Tuesday, and yen crosses’ direction will likely depend on stocks and risk sentiment. Short term, the pair remains trading within a quite clear 117.00/118.80 range, which means a certain directional strength will depend on the break of any of both extremes. In the meantime, the 1 hour chart shows that indicators head higher above their midlines, whilst 100 SMA offers dynamic support around 118.05. In the 4 hours chart technical readings present a mild positive tone, albeit indicators shown no actual strength at the time being, supporting the need of a break higher to confirm more intraday gains.
Support levels: 118.00 117.60 117.30
Resistance levels: 118.80 119.20 119.55
AUD/USD Current price: 0.7919
View Live Chart of the AUD/USD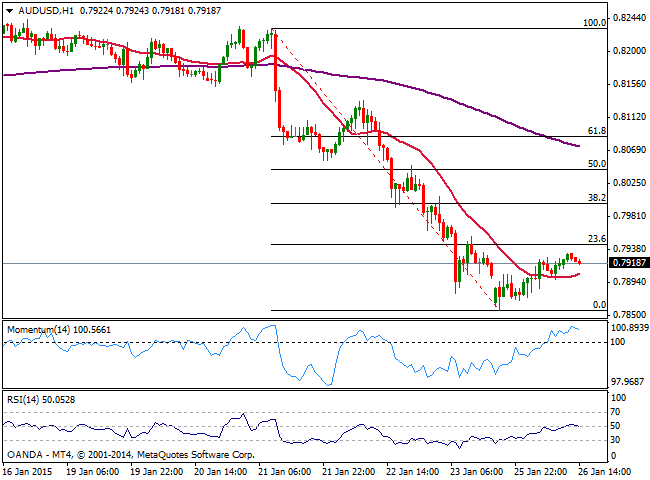
The AUD/USD pair saw a limited intraday demand, as the antipodean currency recovery against the greenback stalled at 0.7933. Gold decline weighted on Aussie, as the metal lost around $ 15 this Monday. From a technical point of view, the dominant bearish trend remains firm in place, as the latest recovery stalled short of the 23.6% retracement of the latest decline. In the 1 hour chart, price stands above a flat 20 SMA whilst indicators are also directionless above their midlines. In the 4 hours chart momentum turns back lower after a limited upward correction, while RSI also losses upward strength around 38, all of which supports upcoming declines particularly if 0.7900 gives up.
Support levels: 0.7900 0.7860 0.7830
Resistance levels: 0.7930 0.7965 0.8000
Recommended Content
Editors’ Picks
EUR/USD clings to gains above 1.0750 after US data

EUR/USD manages to hold in positive territory above 1.0750 despite retreating from the fresh multi-week high it set above 1.0800 earlier in the day. The US Dollar struggles to find demand following the weaker-than-expected NFP data.
GBP/USD declines below 1.2550 following NFP-inspired upsurge

GBP/USD struggles to preserve its bullish momentum and trades below 1.2550 in the American session. Earlier in the day, the disappointing April jobs report from the US triggered a USD selloff and allowed the pair to reach multi-week highs above 1.2600.
Gold struggles to hold above $2,300 despite falling US yields

Gold stays on the back foot below $2,300 in the American session on Friday. The benchmark 10-year US Treasury bond yield stays in negative territory below 4.6% after weak US data but the improving risk mood doesn't allow XAU/USD to gain traction.
Bitcoin Weekly Forecast: Should you buy BTC here? Premium

Bitcoin (BTC) price shows signs of a potential reversal but lacks confirmation, which has divided the investor community into two – those who are buying the dips and those who are expecting a further correction.
Week ahead – BoE and RBA decisions headline a calm week

Bank of England meets on Thursday, unlikely to signal rate cuts. Reserve Bank of Australia could maintain a higher-for-longer stance. Elsewhere, Bank of Japan releases summary of opinions.