EUR/USD Current price: 1.2675
View Live Chart for the EUR/USD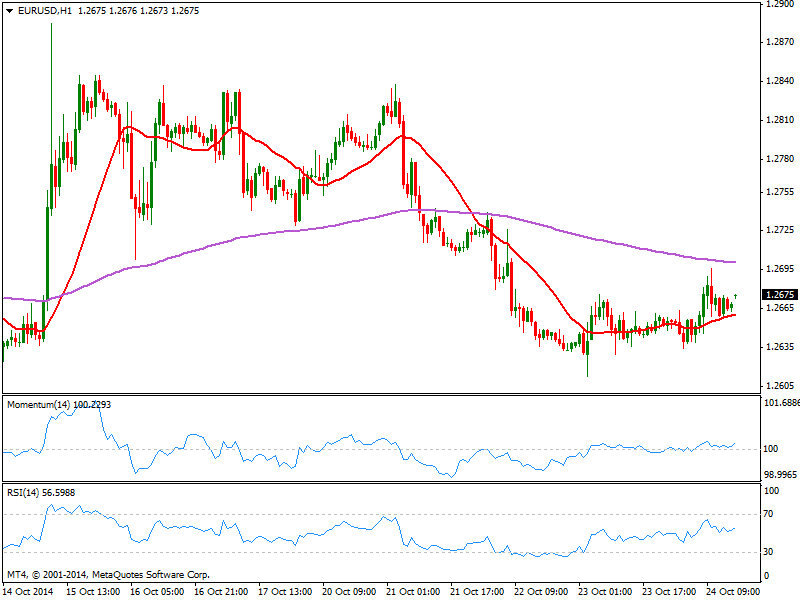
First milestone of the week is finally out, as the ECB released the results of its stress test: matching last week draft and rumors, the headline resulted in 25 banks needing to raise capital for about 25B Euros by the end of 2013, most of which has now been raised by banks. That left 11 banks needing to raise capital, most of them coming from the usual suspects including Italy and Greece. No French, German or Spanish institutions were required to find more capital. The EUR welcomed the news starting the week slightly higher, albeit within latest range.
Friday’s failed attempt to advance beyond the 1.2700 has made of the figure the immediate level to watch over the upcoming hours, as some steady advances above it should anticipate a steadier advance for Monday. Technically, the 1 hour chart shows price above its 20 SMA and indicators aiming slightly higher above their midlines, while the 4 hours chart shows price starting the day above a still bearish 20 SMA and momentum advancing through its midline. A steadier advance beyond 1.2710 is now required to confirm a new leg up, eyeing 1.2750 as immediate target in route to 1.2800.
Support levels: 1.2670 1.2620 1.2580
Resistance levels: 1.2710 1.2750 1.2790
EUR/JPY Current price: 137.28
View Live Chart for the EUR/JPY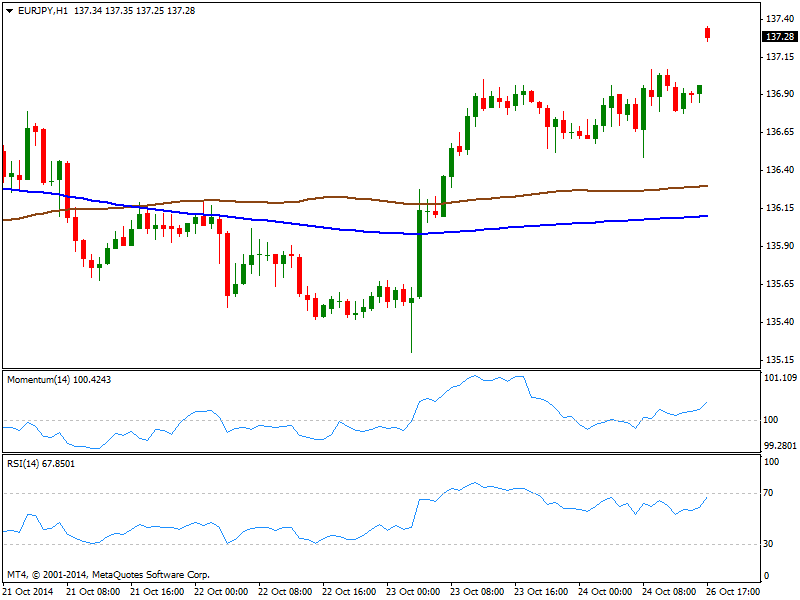
Yen turned sharply lower last week, as US indexes recovered most of the ground lost earlier this month, with the EUR/JPY gapping strongly higher above the 137.00 mark as a new week starts. The pair a few pips below a critical dynamic resistance, the 100 DMA currently at 137.55. Short term, the 1 hour chart shows price managed to extend above its 100 and 200 SMAs’ both flat a hundred pips below current levels, while indicators add bullish momentum above their midlines. In the 4 hours chart momentum aims higher well above 50 while RSI approaches 70 also with a strong upward slope. Several intraday lows at 136.60 price zone suggest buyers await at the level, with a break below required to revert the ongoing positive tone.
Support levels: 137.00 136.60 136.10
Resistance levels: 137.55 138.00 138.40
GBP/USD Current price: 1.6085
View Live Chart for the GBP/USD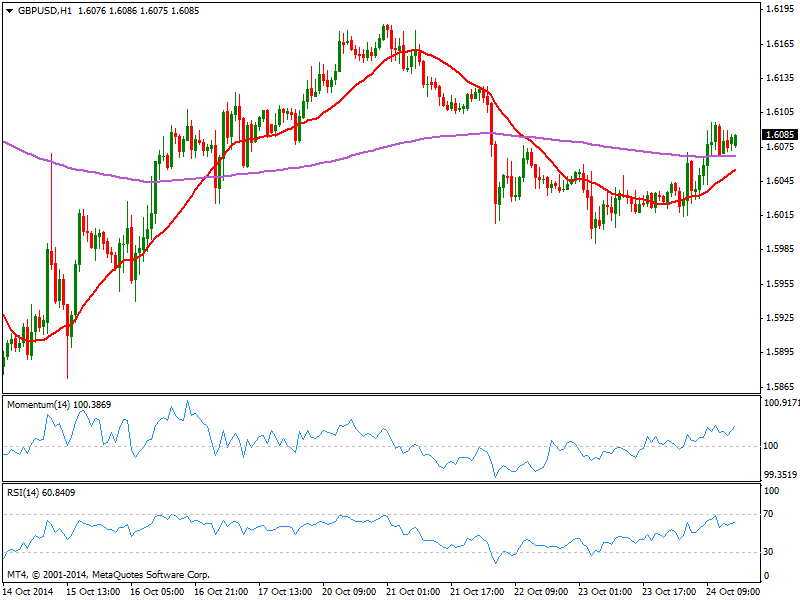
The GBP/USD came back after flirting with 1.6000 last Friday remains quite shallow, as the pair has so far failed to recover above a daily descendant trend line coming from 1.7190, July high, today at 1.6160. Short term however, the 1 hour chart presents a positive tone as indicators head higher above their midlines, as 20 SMA bends higher below current price. In the 4 hours chart latest candles hold above a still bearish 20 SMA, while indicators turn south around their midlines, limiting chances of further short term advances. A static resistance at 1.6125 has attracted sellers on approaches, so only a clear break above it will favor some intraday gains up to mentioned trend line in the 1.6160 price zone. Failure to hold above 1.6070 on the other hand, exposes the pair to another dip towards the 1.6000 price zone.
Support levels: 1.6070 1.6030 1.5995
Resistance levels: 1.6125 1.6160 1.6200
USD/JPY Current price: 108.30
View Live Chart for the USD/JPY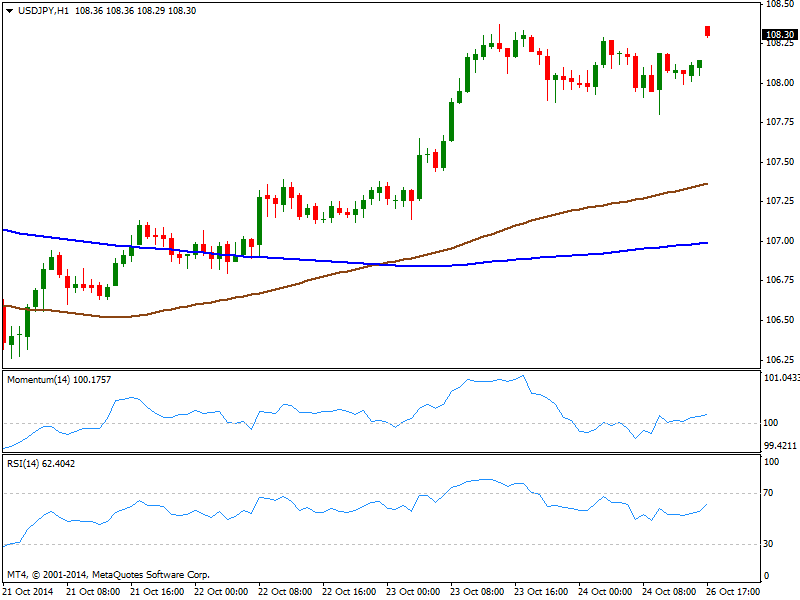
The USD/JPY also gaps higher, trading near latest highs and with a mild positive tone coming from technical readings in the 1 hour chart as indicators aim higher above their midlines, and 100 SMA advances fastest than 200 one, widening the distance in between both well below current price. In the 4 hours chart however, technical readings had lost their upward strength despite holding near overbought levels, while 200 SMA stands above 100 one, which limits chances of a stronger rally. With some highs at current levels, a clear advance beyond 108.50 is required to trigger stops and see the pair advancing towards 108.90 price zone.
Support levels: 107.80 107.45 107.00
Resistance levels: 108.50 108.90 109.30
AUD/USD Current price: 0.8801
View Live Chart of the AUD/USD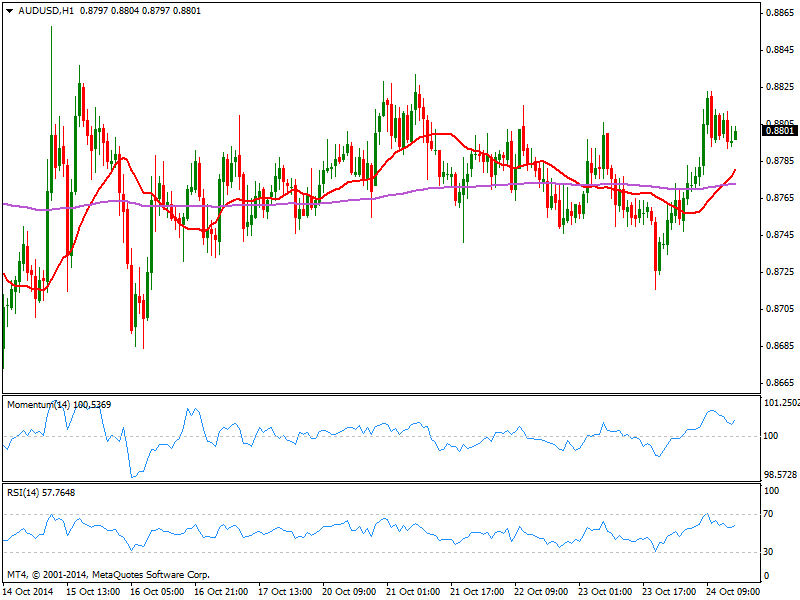
The AUD/USD was rejected once again from 0.8820 last Friday, having been as high as 0.8823 after surging from a weekly low of 0.8716 posted late Thursday. The wider picture is still unclear, with the pair trading at the higher half of the 0.8640/0.8820 range, but short term bulls seem to be in control of the pair: the 1 hour chart shows indicators aiming higher after correcting overbought readings, while 20 SMA advances strongly now overcoming 200 EMA. In the 4 hours chart technical readings maintain a quite neutral stance, with price still moving back and forth around a flat 20 SMA and indicators around their mildines. Risk remains to the upside on a surge of risk appetite, yet some follow through above mentioned resistance is still required to define an upward continuation in the pair.
Support levels: 0.8770 0.8730 0.8690
Resistance levels: 0.8820 0.8860 0.8900
Recommended Content
Editors’ Picks
AUD/USD retargets the 0.6600 barrier and above

AUD/USD extended its positive streak for the sixth session in a row at the beginning of the week, managing to retest the transitory 100-day SMA near 0.6580 on the back of the solid performance of the commodity complex.
EUR/USD keeps the bullish bias above 1.0700

EUR/USD rapidly set aside Friday’s decline and regained strong upside traction in response to the marked retracement in the Greenback following the still-unconfirmed FX intervention by the Japanese MoF.
Gold advances for a third consecutive day

Gold fluctuates in a relatively tight channel above $2,330 on Monday. The benchmark 10-year US Treasury bond yield corrects lower and helps XAU/USD limit its losses ahead of this week's key Fed policy meeting.
Bitcoin price dips to $62K range despite growing international BTC validation via spot ETFs

Bitcoin (BTC) price closed down for four weeks in a row, based on the weekly chart, and could be on track for another red candle this week. The last time it did this was in the middle of the bear market when it fell by 42% within a span of nine weeks.
Japan intervention: Will it work?

Dear Japan Intervenes in the Yen for the first time since November 2022 Will it work? Have we seen a top in USDJPY? Let's go through the charts.