EUR/USD Current price: 1.2815
View Live Chart for the EUR/USD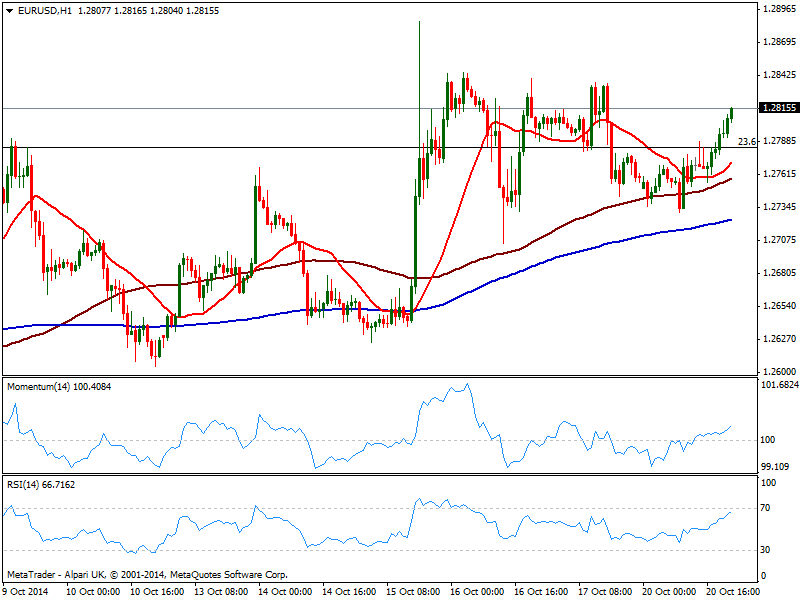
The EUR/USD trades at its daily high, right above the 1.2800 level in an extremely quiet Monday, helped by a comeback in US indexes after the opening stumble triggered by IBM: the company shares dropped over 7%, dragging DJIA down 100 points. But indexes managed to erase their intraday gains all through the session, recovering to break even by US close. There was no fundamental data to lead markets and for the pair, main readings will include European PMIs on Thursday and US CPI on Wednesday. In the meantime, market moved in slowmo for the last 24 hours, with dollar generally lower across the board.
Technically, the EUR/USD hourly chart shows price advancing above its moving averages as indicators aim higher above their midlines, showing no actual strength. In the 4 hours chart indicators turned higher hovering now around their midline, also lacking momentum at the time being, while price hovers around a bullish 20 SMA. Despite the lack of strength, the picture is bullish in the short term with 1.2845 as immediate resistance as per several intraday highs around the level from last week.
Support levels: 1.2790 1.2740 1.2700
Resistance levels: 1.2845 1.2890 1.2930
EUR/JPY Current price: 136.85
View Live Chart for the EUR/JPY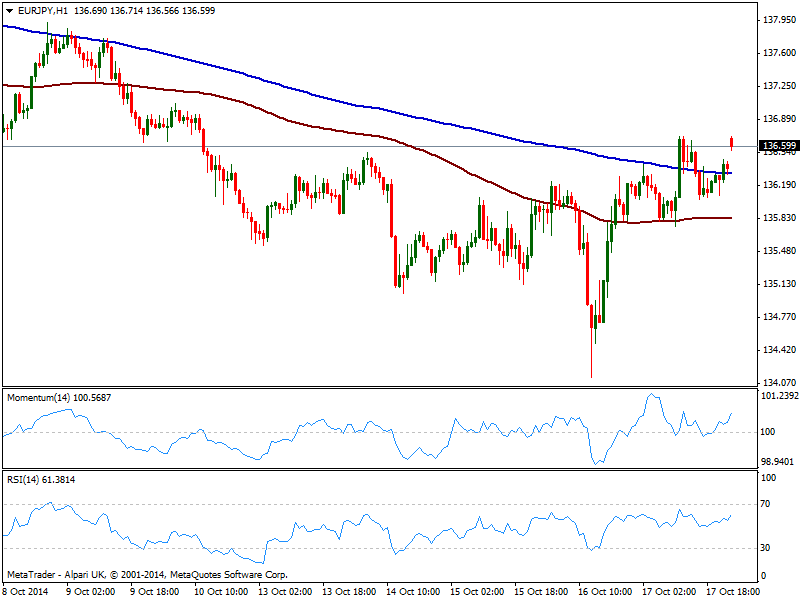
Yen maintains a general positive tone against most rivals, easing however against the EUR on the back of this latest short term strength. The pair stands pretty much unchanged intraday, yet the 1 hour chart shows buyers surged on an approach to 200 SMA, still the immediate support around 136.30. Indicators in this last time frame diverge from each other in neutral territory, without signaling a clear upcoming direction. In the 4 hours chart 100 SMA capped the upside earlier on the day, now around 137.05, while indicators aim higher above their midlines, supporting some follow through on a price acceleration above mentioned resistance.
Support levels: 136.30 135.80 135.50
Resistance levels: 137.05 137.45 137.90
GBP/USD Current price: 1.6172
View Live Chart for the GBP/USD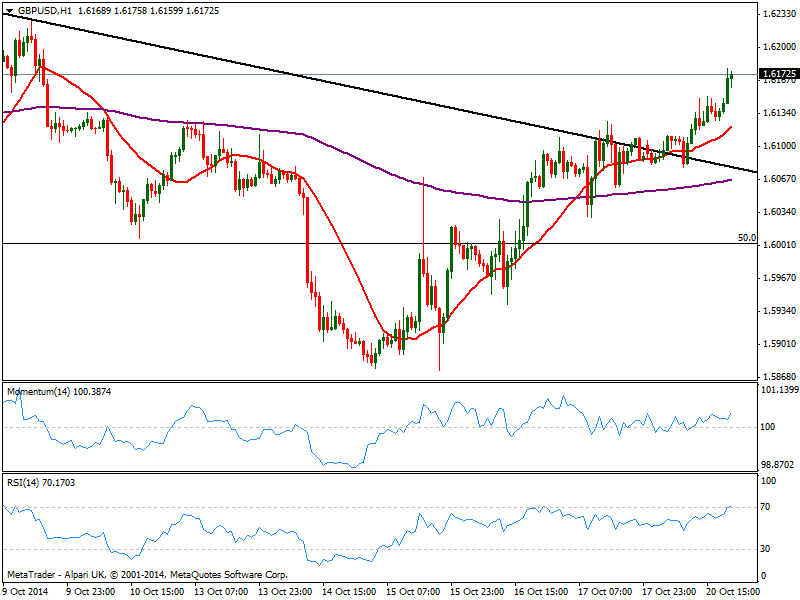
Pound outperformed, printing a whopping 80 pips advance against the greenback, accelerating north after finally overcoming a strong static resistance area in the 1.6110/25 price zone, formed by a daily descendant trend line, and a 10 day high. The 1 hour chart shows 20 SMA gaining bullish slope below current price and indicators heading higher above their midlines, still far from reaching overbought readings. In the 4 hours chart the steady advance left 20 SMA now converging with the broken trend line around 1.6070/80, probable buying level in case of retracements, as indicators hold in positive territory with a mild bullish tone. 200 EMA in this last time frame stands at 1.6220, also October 9th daily low, becoming next bullish target on a continued advance.
Support levels: 1.6150 1.6125 1.6060
Resistance levels: 1.6185 1.6220 1.6260
USD/JPY Current price: 106.82
View Live Chart for the USD/JPY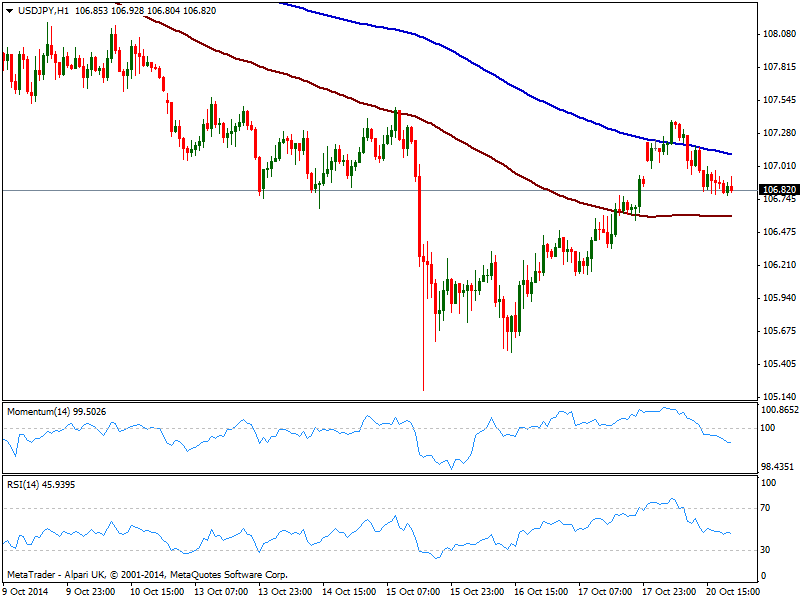
The USD/JPY ended the day pretty much where it started, having failed to sustain gains above the 107.00 mark. According to the 1 hour chart, a mild bearish tone prevails as indicators aim lower below their midlines, albeit price remains midway between 100 and 200 SMAs, with the shortest offering dynamic support around 106.60. In the 4 hours chart however, indicators aim higher in positive territory after correcting some overbought levels, with moving averages still way above current price. Either some strength above 107.35 or a break below 106.60 is required to set a more directional tone in the pair for the upcoming 24 hours.
Support levels: 106.60 106.30 106.05
Resistance levels: 107.35 107.60 108.00
AUD/USD Current price: 0.8791
View Live Chart of the AUD/USD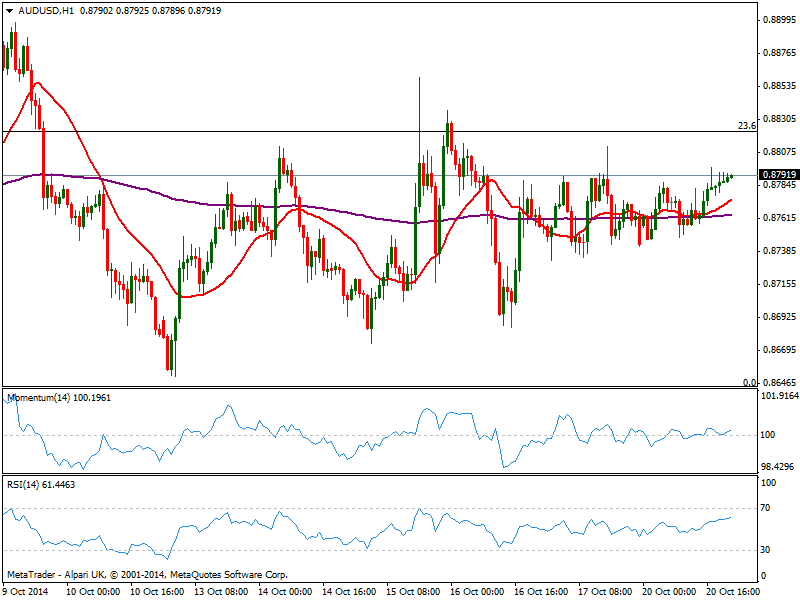
The AUD/USD advances towards the 0.8800 figure, slowly but steadily amid dollar weakness. But the pair maintains a tight range daily basis, with the 1 hour chart shows price advancing above a mild bullish 20 SMA, and indicators aiming higher above their midlines. In the 4 hours chart, the air presents a also a shy positive tone, yet for the most, range has prevailed during the last couple of weeks. Over Asian hours, the RBA will release the Minutes of its latest meeting, while China will publish several macro readings, the most relevant being local GDP data. As for the Minutes, no surprises are expected there, but Chinese data indeed can imprint some action to the pair, with positive readings probably pushing price above 0.8820 immediate resistance. Sustained gains above this last should favor further intraday advances, albeit negative numbers may weight on Aussie and drag it down towards 0.8730 support.
Support levels: 0.8770 0.8730 0.8690
Resistance levels: 0.8820 0.8860 0.8900
Recommended Content
Editors’ Picks
AUD/USD gains momentum above 0.6500 ahead of Australian Retail Sales data

AUD/USD trades in positive territory for six consecutive days around 0.6535 during the early Asian session on Monday. The upward momentum of the pair is bolstered by the hawkish stance from the Reserve Bank of Australia after the recent release of Consumer Price Index inflation data last week.
EUR/USD holds positive ground above 1.0700, eyes on German CPI data

EUR/USD trades on a stronger note around 1.0710 during the early Asian trading hours on Monday. The weaker US Dollar below the 106.00 mark provides some support to the major pair.
Gold trades on a softer note below $2,350 on hotter-than-expected US inflation data

Gold price trades on a softer note near $2,335 on Monday during the early Asian session. The recent US economic data showed that US inflationary pressures staying firm, which has added further to market doubts about near-term US Federal Reserve rate cuts.
Ethereum fees drops to lowest level since October, ETH sustains above $3,200

Ethereum’s high transaction fees has been a sticky issue for the blockchain in the past. This led to Layer 2 chains and scaling solutions developing alternatives for users looking to transact at a lower cost.
Week ahead: Hawkish risk as Fed and NFP on tap, Eurozone data eyed too

Fed meets on Wednesday as US inflation stays elevated. Will Friday’s jobs report bring relief or more angst for the markets? Eurozone flash GDP and CPI numbers in focus for the Euro.