EUR/USD Current price: 1.2931
View Live Chart for the EUR/USD
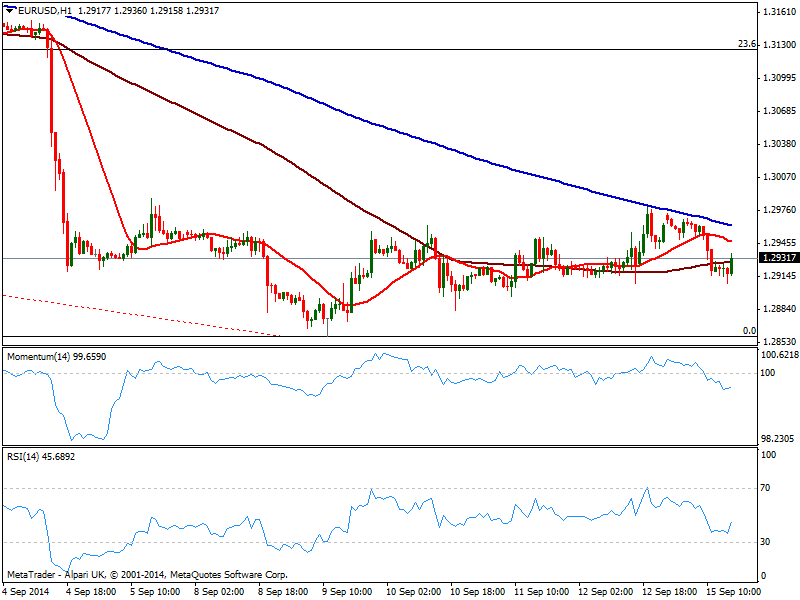
The EUR/USD bounces from its daily low of 1.2908 early US session, after the release of US NY manufacturing index came out at 27.5 a multiyear high but industrial data missed expectations. Dollar gains however are being limited, ahead of critical data later on the week. In the meantime, the EUR/USD hourly chart presents a mild bearish tone, with price back below its 100 SMA after failing to advance beyond 200 one early Asia, and indicators heading lower into negative territory. In the 4 hours chart technical readings present a more neutral stance, with indicators around their midlines and price around a flat 20 SMA. Lows at 1.2860/80 area should maintain the downside contain if the bearish momentum increase.
Support levels: 1.2910 1.2870 1.2835
Resistance levels: 1.2950 1.2990 1.3045
GBP/USD Current price: 1.6240
View Live Chart for the GBP/USD
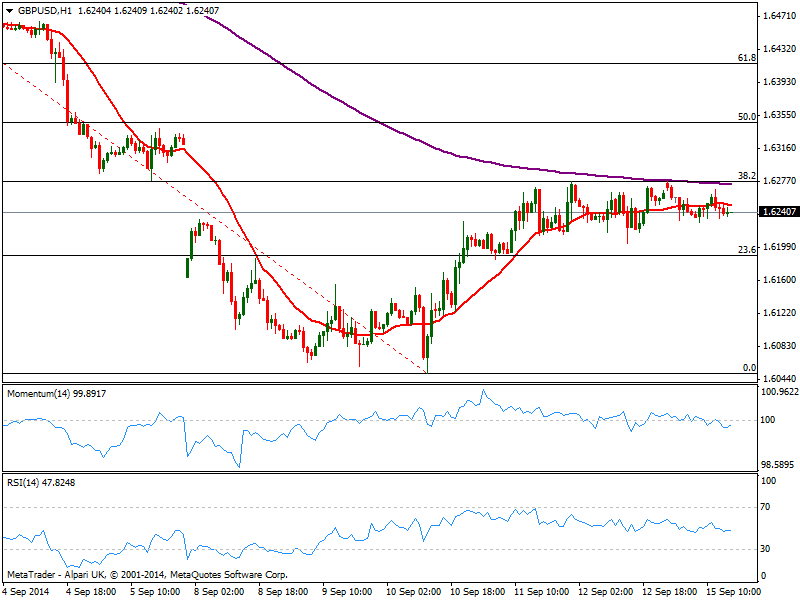
The GBP/USD entered wait and see mode, with the pair still stuck midrange between Fibonacci levels, ahead of critical UK data starting on Tuesday with local inflation readings. Attempts to rise remained contained by the 38.2% retracement of the latest bearish daily run around 1.6280, with the 1 hour chart showing a quite neutral technical stance as per latest constrained range. In the 4 hours chart indicators turned lower but remain above their midlines, with price approaching a bullish 20 SMA around 1.6220 immediate short term support. Anyway a break below 1.6190, 23.6% retracement of the same rally, is required to confirm a more steady intraday decline towards 1.6140/50 price zone.
Support levels: 1.6220 1.6190 1.6150
Resistance levels: 1.6280 1.6320 1.6350
USD/JPY Current price: 107.14
View Live Chart for the USD/JPY
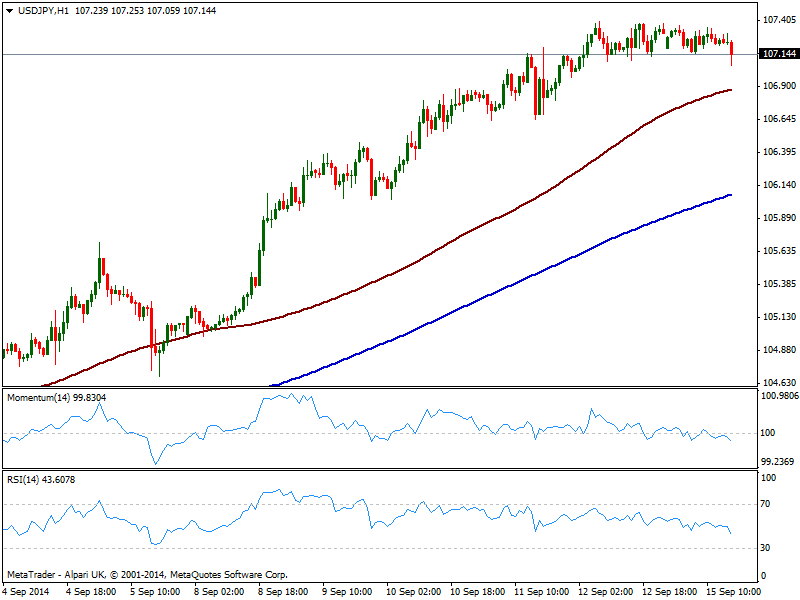
The USD/JPY trades in a limited 30 pips range near its recent multi-month high of 107.38, giving no clues on what’s next in the short term, as per price well above a bullish 100 SMA and indicators with a slightly bearish tone due to latest slide, right below their midlines, yet far from suggesting a strong bearish momentum. In the 4 hours chart indicators had partially corrected extreme overbought leadings but remain well into positive territory, which limits possibilities of a stronger downward move in the short term. 107.40 immediate resistance however, refuses to give up, so a stronger upward acceleration above the level is required to see the pair resuming its bullish trend.
Support levels: 106.80 106.50 106.10
Resistance levels: 107.40 107.90 108.20
AUD/USD Current price: 0.9032
View Live Chart of the AUD/USD
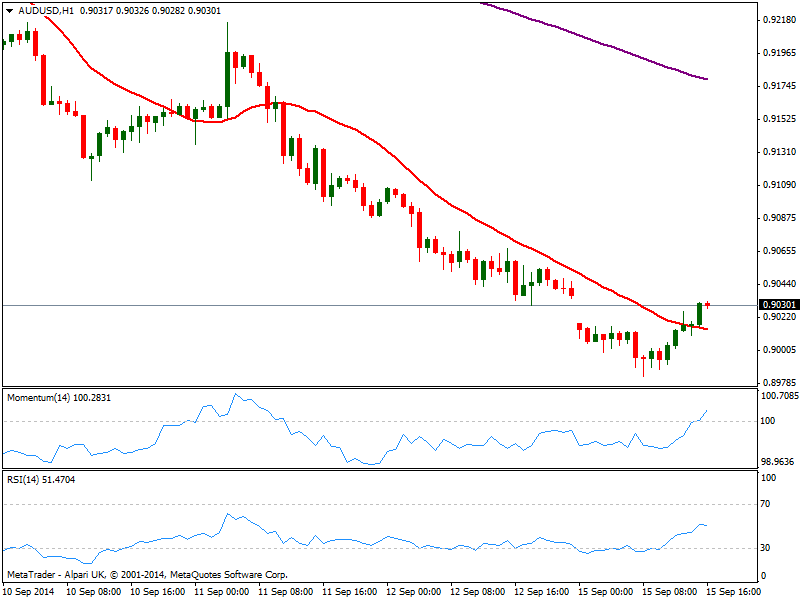
The AUD/USD tested levels sub 0.9000 early Europe, recovering some ground after weak US data, with the pair filling the weekly opening gap just now. The 1 hour chart shows price above its 20 SMA and indicators heading higher above their midlines, yet price action seems not able to follow through. In the 4 hours chart indicators barely corrected oversold readings before turning back flat well into negative territory, while 20 SMA maintains a strong bearish slope well above current price, limiting chances of a steadier advance.
Support levels: 0.9000 0.8960 0.8920
Resistance levels: 0.9040 0.9070 0.9110
Recommended Content
Editors’ Picks
EUR/USD hovers near 1.0700 even as USD struggles ahead of data

EUR/USD has erased gains to trade flat near 1.0700 in the European session on Thursday. The pair comes under pressure even as the US Dollar struggles, in the aftermath of the Fed policy announcements and ahead of more US employment data.
GBP/USD turns south toward 1.2500, US data eyed

GBP/USD is consolidating the rebound above 1.2500 in European trading on Thursday. The pair struggles, despite the US Dollar weakness on dovish Fed signals. A mixed market mood caps the GBP/USD upside ahead of mid-tier US data.
Gold price pulls back as market sentiment improves

The Gold price is trading in the $2,310s on Thursday after retracing about three-tenths of a percent on reduced safe-haven demand. Market sentiment is overall positive as Asian stocks on balance closed higher and Oil prices hover at seven-week lows.
Top 3 Price Prediction BTC, ETH, XRP: Altcoins to pump once BTC bottoms out, slow grind up for now

Bitcoin reclaiming above $59,200 would hint that BTC has already bottomed out, setting the tone for a run north. Ethereum holding above $2,900 keeps a bullish reversal pattern viable despite falling momentum. Ripple coils up for a move north as XRP bulls defend $0.5000.
Happy Apple day

Apple is due to report Q1 results today after the bell. Expectations are soft given that Apple’s Chinese business got a major hit in Q1 as competitors increased their market share against the giant Apple.