EUR/USD Current price: 1.3532
View Live Chart for the EUR/USD
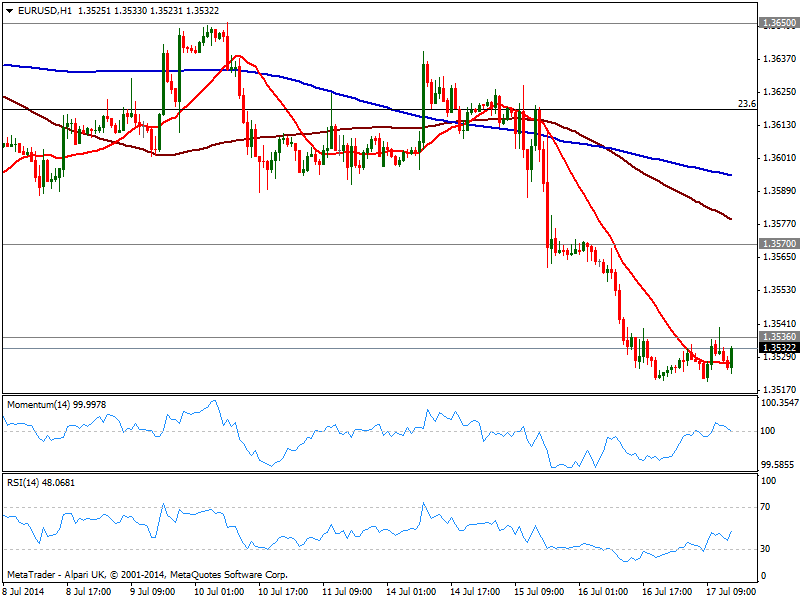
The EUR/USD has shown little progress over the past 24 hours, consolidating in a tight range right above the weekly low of 1.3520. The hourly chart shows price hovering around a flat 20 SMA while indicators stand around their midlines, giving little idea of what’s next for the pair. US yields down are putting the greenback under some pressure across the board, but for the most, ranges prevail. In the 4 hours chart indicators point to correct extreme oversold readings, looking for a probable test of the 1.3570 strong static resistance zone. Failure to advance however, exposes the year low of 1.3476, still a probable target for the upcoming sessions.
Support levels: 1.3500 1.3476 1.3440
Resistance levels: 1.3535 1.3570 1.3620
GBP/USD Current price: 1.7105
View Live Chart for the GBP/USD
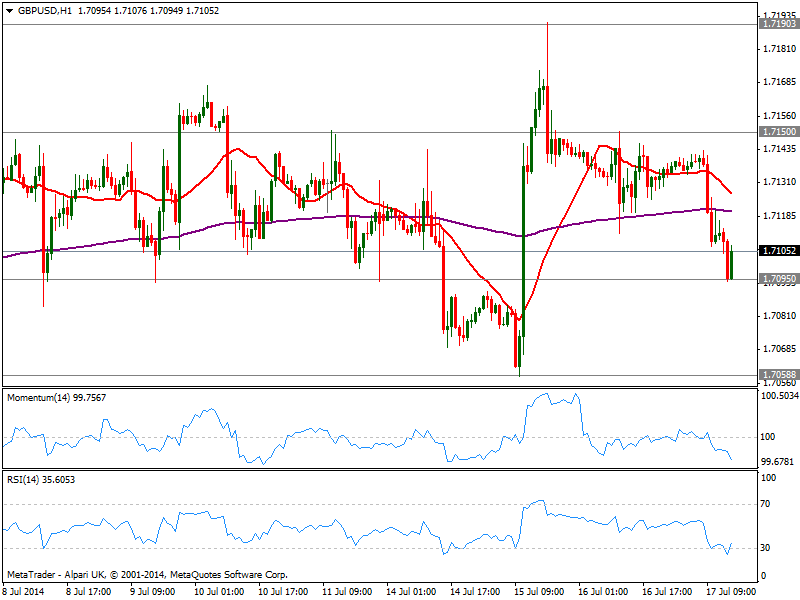
The GBP/USD is down on the day, holding right above the 1.7095 static support level, having been steadily falling since early European opening. The hourly chart shows price around 1.7100 with 20 SMA heading lower above current price and indicators in oversold territory. In the 4 hours chart however, technical readings maintain the neutral stance seen over the past sessions, with price below a flat 20 SMA and indicators heading lower around their midlines. Break below mentioned support may see price easing towards 1.7060, 23.6% retracement of the latest bullish run, while further downward momentum will be seen on a break below this last.
Support levels: 1.7095 1.7060 1.7020
Resistance levels: 1.7120 1.7150 1.7180
USD/JPY Current price: 101.44
View Live Chart for the USD/JPY
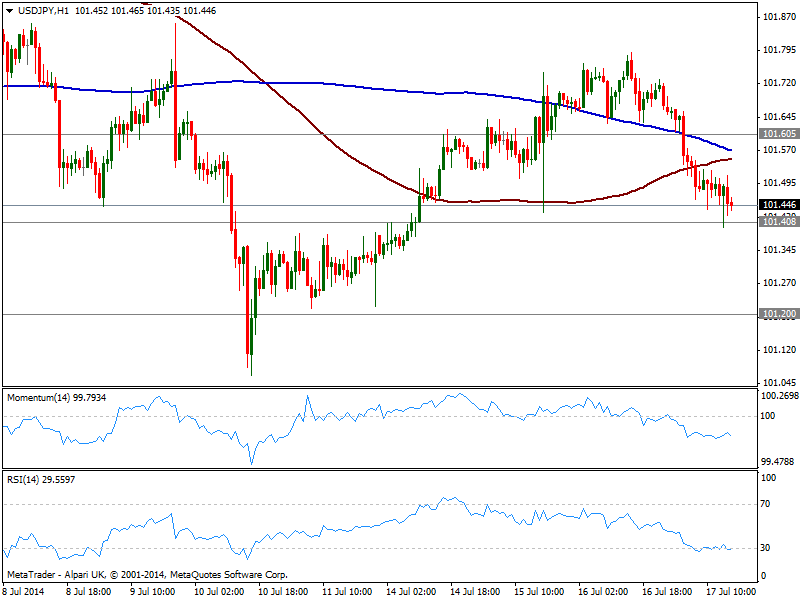
The USD/JPY eased down to 101.40 where it stands early US session, presenting a short term bearish tone, as the hourly chart shows price below 100 and 200 SMAs and momentum heading lower in negative territory. In the 4 hours chart the technical picture is also bearish, supporting a test of strong static support at 101.20. A break below this last exposes the year low around 100.70.
Support levels: 101.40 101.20 100.70
Resistance levels: 101.95 102.35 102.80
AUD/USD Current price: 0.9384
View Live Chart for the AUD/USD
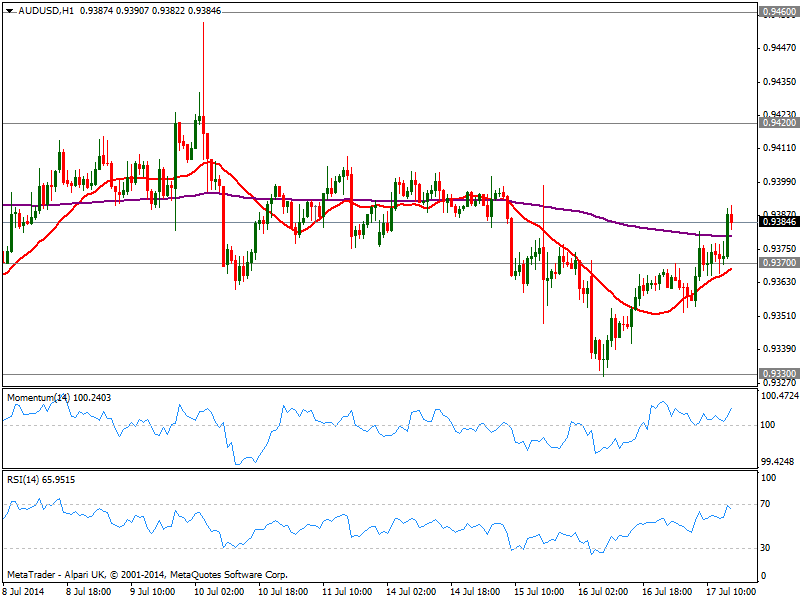
Aussie extended its recovery against the greenback with the pair now above 0.9370 and approaching 0.9400 figure. The hourly chart shows indicators heading higher above their midlines and 20 SMA acting as dynamic support currently near strong static support of 0.9370. In the 4 hours chart a mild bullish tone is also present, with indicators aiming to cross their midlines to the upside and price above moving averages.
Support levels: 0.9370 0.9330 0.9300
Resistance levels: 0.9420 0.9460 0.9500
Recommended Content
Editors’ Picks
AUD/USD gains momentum above 0.6500 ahead of Australian Retail Sales data

AUD/USD trades in positive territory for six consecutive days around 0.6535 during the early Asian session on Monday. The upward momentum of the pair is bolstered by the hawkish stance from the Reserve Bank of Australia after the recent release of Consumer Price Index inflation data last week.
EUR/USD: Federal Reserve and Nonfarm Payrolls spell action this week

The EUR/USD pair temporarily reconquered the 1.0700 threshold last week, settling at around that round level. The US Dollar lost its appeal following discouraging United States macroeconomic data indicating tepid growth and persistent inflationary pressures.
Gold: Strength of $2,300 support is an encouraging sign for bulls

Gold price started last week under heavy bearish pressure and registered its largest one-day loss of the year on Monday. The pair managed to stage a rebound in the second half of the week but closed in negative territory.
Ethereum fees drops to lowest level since October, ETH sustains above $3,200

Ethereum’s high transaction fees has been a sticky issue for the blockchain in the past. This led to Layer 2 chains and scaling solutions developing alternatives for users looking to transact at a lower cost.
Week ahead – Hawkish risk as Fed and NFP on tap, Eurozone data eyed too

Fed meets on Wednesday as US inflation stays elevated. Will Friday’s jobs report bring relief or more angst for the markets? Eurozone flash GDP and CPI numbers in focus for the Euro.