EUR/USD Current price: 1.3607
View Live Chart for the EUR/USD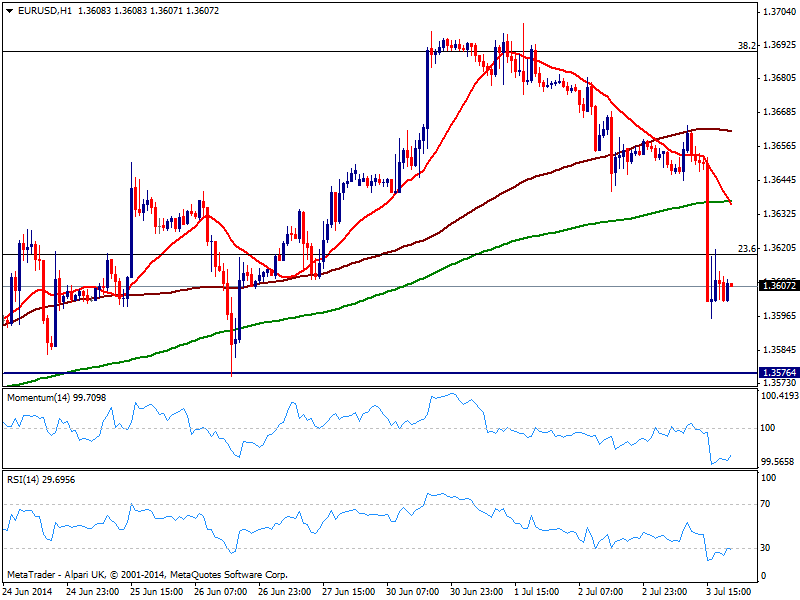
It was quite an entertained day in the forex market, albeit looking at the EUR/USD chart you won’t notice: beside a huge bearish candle, the pair has moved from one range to another. Among the hurdle of data, ECB economic policy and US employment figures outstood, with the ECB leaving rates unchanged and Super Mario suggesting TLTRO may see uptake of as much as EUR 1T, overall EUR bearish. As for NFP, the American economy added 288K new jobs in June, lowering unemployment rate to 6.1%, and giving the dollar some further air after last week losses. But across the board, seems the number was not enough to trigger a dollar rally, let’s not talk about reversals: FED’s path is well priced in and it will take more than one positive number to made investors change their view.
Anyway, and for the EUR/USD the hourly chart shows price ranging now in between 1.3595 daily low and the 23.6% retracement of the 1.40/1.35 fall at 1.3620. Indicators turned flat in oversold levels, while 20 SMA extended its decline below both 100 and 200 SMAs, keeping the pressure to the downside. In the 4 hours chart technical readings present a strong bearish momentum, while 20 SMA turns south in the 1.3670/80 price zone, offering dynamic resistance in case of recoveries. To the downside, immediate support stands in the 1.3570/80 area where price stalled several times over the last few weeks, with a break below exposing 1.3500 area.
Support levels: 1.3575 1.3530 1.3500
Resistance levels: 1.3645 1.3675 1.3700
EUR/JPY Current price: 138.90
View Live Chart for the EUR/JPY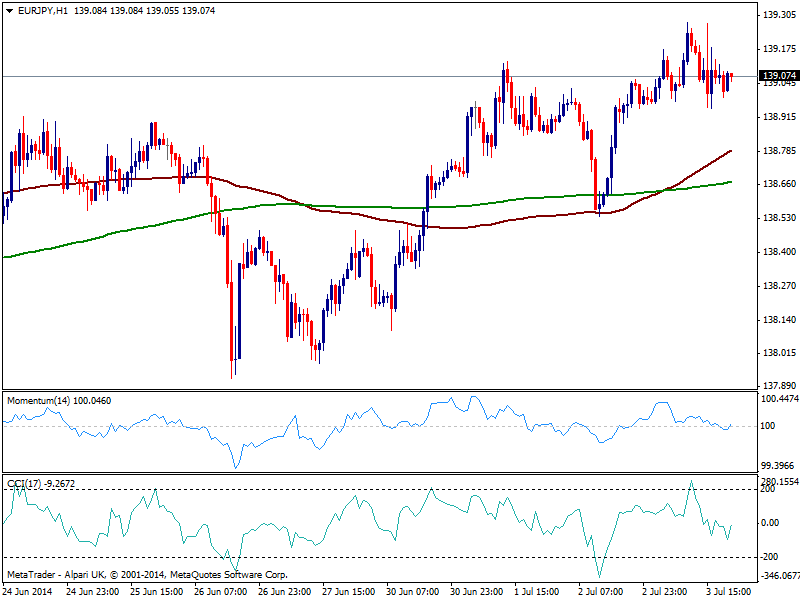
Stocks had a big feast with German DAX closing above 10,000 quite close to its all time highs, while all of US major indexes closing higher on Thursday: DJIA is the shinning start, crossing the 17,000 mark for the first time ever, and closing up about 1.3% on the week. Yen crosses saw some upward momentum after the headlines, and should have remained supported by rising stocks, but 10year notes erased all of their intraday gains before the closing bell, capping the rallies. The EUR/JPY advanced up to 139.27 before settling around its daily opening, pretty much unchanged on the day. Nevertheless and despite EUR weakness, the pair presents a mild positive tone in the hourly chart as per 100 SMA crossing to the upside 200 one, both below current price, as indicators turn north around their midlines. In the 4 hours chart the technical picture is neutral, with indicators around their midlines and moving averages flat, giving little support to latest recovery. Some steady gains beyond 139.35 may support some upward continuation, eyeing then the critical 140.00 figure, albeit further gains are not seen for the last day of the week.
Support levels: 138.90 138.45 137.90
Resistance levels: 139.35 139.80 140.20
GBP/USD Current price: 1.7149
View Live Chart for the GBP/USD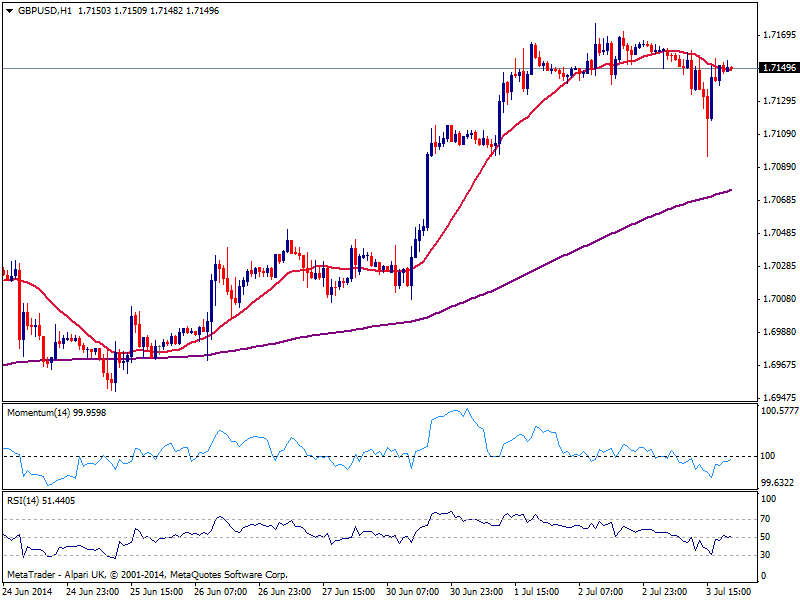
Pound was under mild pressure since early European opening, hit by worse than expected UK Services PMI, down to 57.7. Dollar momentum with the strong employment number sent GBP/USD to a daily low of 1.7095, where buyers surged pushing the pair back near its daily high of 1.7166. As commented on previous updates, GBP self strength will be hard to defy and further gains should be expected, and dips are seen as buying opportunities rather than possible tops. Short term, the hourly chart shows price struggling to overcome its 20 SMA and indicators around their midlines, while the 4 hours chart shows latest candle opened above a still bullish 20 SMA and indicators bouncing from their midlines after correcting overbought readings. At this point, some upward acceleration above 1.7160 is required to confirm a continuation rally, eyeing levels above 1.7200 for the upcoming sessions.
Support levels: 1.7130 1.7095 1.7060
Resistance levels: 1.7180 1.7220 1.7250
USD/JPY Current price: 102.20
View Live Chart for the USD/JPY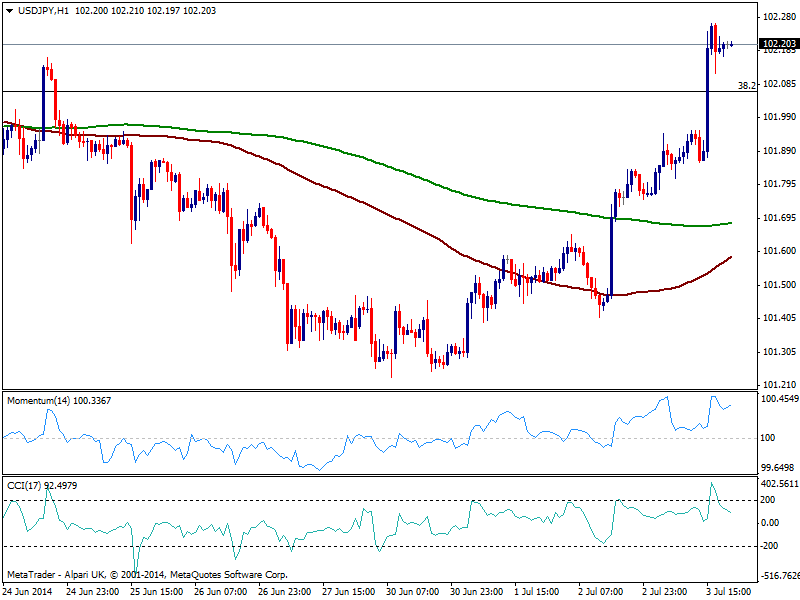
The USD/JPY got rid of the bearish pressure seen over the past weeks, and advanced beyond the 102.00 figure before stalling: in fact, and despite pressuring the daily highs, the pair is unable to advance above its 100 DMA, at current levels. Anyway, the upward seems more constructive now, with momentum regaining the upside after correcting some of its overbought readings, and price well above moving averages. In the 4 hours chart indicators look slightly exhausted in extreme overbought levels, but so far price actions does not suggest a downward correction on the makes. An advance beyond 102.35 should signal an upward continuation towards 102.80 strong congestion zone as per several intraday highs and lows around the level. Back below 102.00 however, the upside will be deny and risk turns back towards a retest of the year lows around 100.60/70.
Support levels: 101.90 101.60 101.20
Resistance levels: 102.35 102.80 103.10
AUD/USD Current price: 0.9348
View Live Chart for the AUD/USD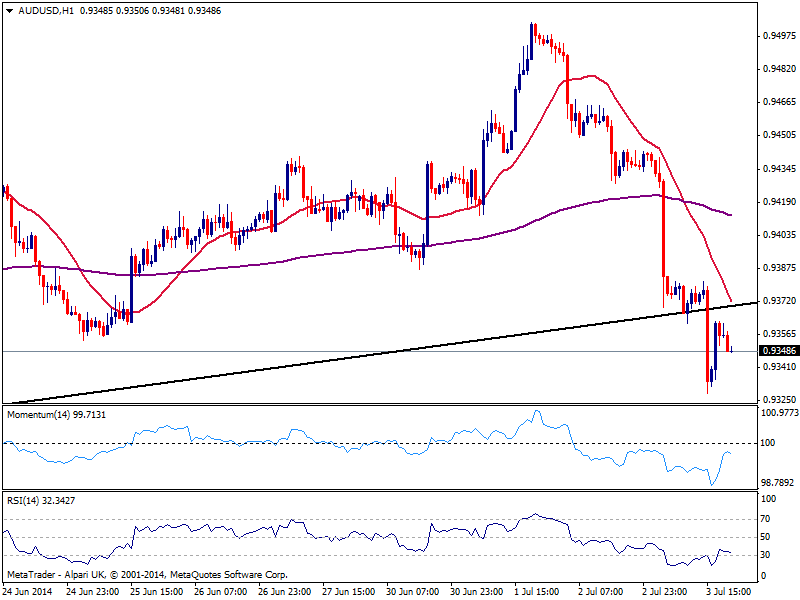
Not a good day for Aussie buyers, with the currency under pressure since past Asian session: RBA Governor Stevens said there had not been any thoughts of raising interest rates, and that the economic policy will remain steady for long. US employment did the rest, and the pair sunk towards the latest support, down to 0.9328; buyers so far defended the level, but the bounce remains shallow and capped below a daily ascendant trend line coming from this year low of 0.8659 broken this Thursday. The hourly chart shows indicators turning back south below their midlines after correcting oversold readings, while 20 SMA converges with the mentioned trend line, both around 0.9380. In the 4 hours chart indicators aim slightly higher in oversold levels, but far from supporting an upward movement at the time being. Further downward pressure below mentioned support may see the pair extending down to 0.9260, strong midterm support, yet opening doors then for a continued slide for the upcoming days.
Support levels: 0.9330 0.9300 0.9260
Resistance levels: 0.9380 0.9420 0.9460
Recommended Content
Editors’ Picks
AUD/USD eases toward 0.6500 after mixed Australian trade data

AUD/USD is seeing some fresh selling interest in the Asian session on Thursday, following the release of mixed Australian trade data. The pair has stalled its recovery mode, as the US Dollar attempts a bounce after the Fed-led sell-off.
USD/JPY holds rebound near 156.00 after probable Japan's intervention-led crash

USD/JPY consolidates the rebound near 156.00, having lost nearly 450 pips in some minutes after the Japanese Yen rallied hard on another suspected Japan FX market intervention in the late American session on Wednesday.
Gold price stalls rebound below $2,330 as US Dollar recovers

Gold price is holding the rebound below $2,330 in Asian trading on Thursday, as the US Dollar recovers in sync with the USD/JPY pair and the US Treasury bond yields, in the aftermath of the Fed decision and the likely Japanese FX intervention.
Top 3 Price Prediction BTC, ETH, XRP: Altcoins to pump once BTC bottoms out, slow grind up for now

Bitcoin reclaiming above $59,200 would hint that BTC has already bottomed out, setting the tone for a run north. Ethereum holding above $2,900 keeps a bullish reversal pattern viable despite falling momentum. Ripple coils up for a move north as XRP bulls defend $0.5000.
The FOMC whipsaw and more Yen intervention in focus

Market participants clung to every word uttered by Chair Powell as risk assets whipped around in a frenetic fashion during the afternoon US trading session.