EUR/USD Current price: 1.3654
View Live Chart for the EUR/USD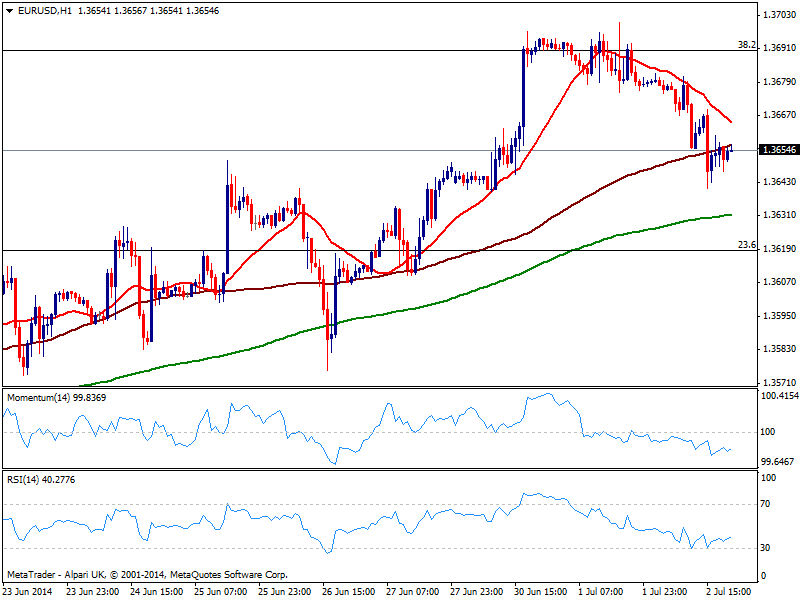
Dollar gathered some pace against its rivals on Wednesday, following the release of the strongest ADP reading in almost 2 years, up to 281K. The EUR/USD which was already under pressure after failing around 1.3700, extended its decline to post a daily low of 1.3640 before halting, finally closing the day below its 200 DMA again. If it weren’t because of ECB and US Payrolls on Thursday, the pair should continue falling over the upcoming sessions according to technical readings, yet both are consider game changers so cautious should prevail until the releases.
Nevertheless and from a technical point of view, the hourly chart shows indicators in negative territory and price developing below 20 and 100 SMAs, showing no directional strength. In the 4 hours chart price stands below 20 SMA while indicators hover around their midlines, having erased early week overbought conditions. Ahead of the news, critical levels to watch are recent highs of 1.3700 to the upside and 1.3570 to the downside, as a break of any extreme should lead to a continued move.
Support levels: 1.3645 1.3610 1.3570
Resistance levels: 1.3675 1.3700 1.3735
EUR/JPY Current price: 139.05
View Live Chart for the EUR/JPY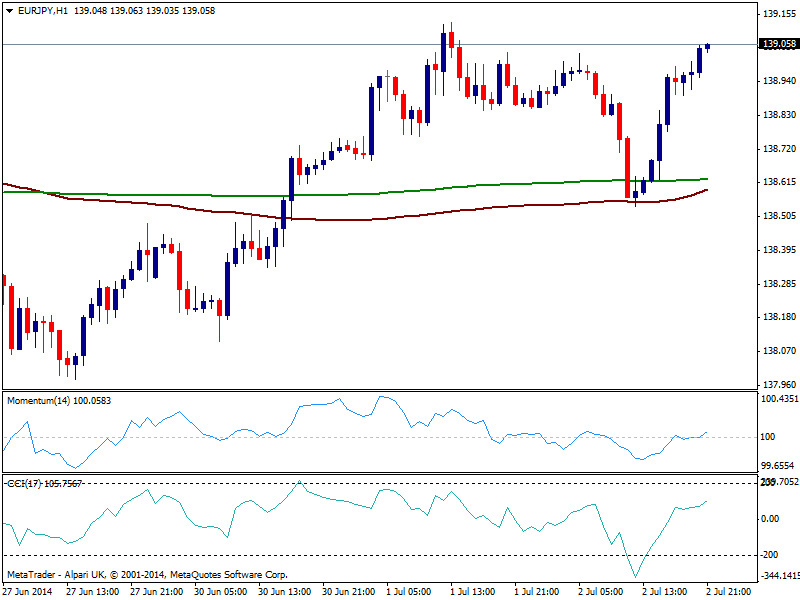
The EUR/JPY nears weekly highs as the yen weakened against all rivals, not because of stocks that traded mostly unchanged in the US afternoon, but because of the strong employment survey that boosted USD/JPY along with US yields, with the 106Y note up to 2.62%. The hourly chart shows price holding above 139.00 by little, with moving averages flat and converging around 138.50, reflecting the lack of direction that prevails in the pair. Indicators in the same time frame present a mild positive tone yet show no strength at the time being, while the 4 hours chart shows indicators in positive territory but also flat.
Support levels: 138.90 138.45 137.90
Resistance levels: 139.35 139.80 140.40
GBP/USD Current price: 1.7163
View Live Chart for the GBP/USD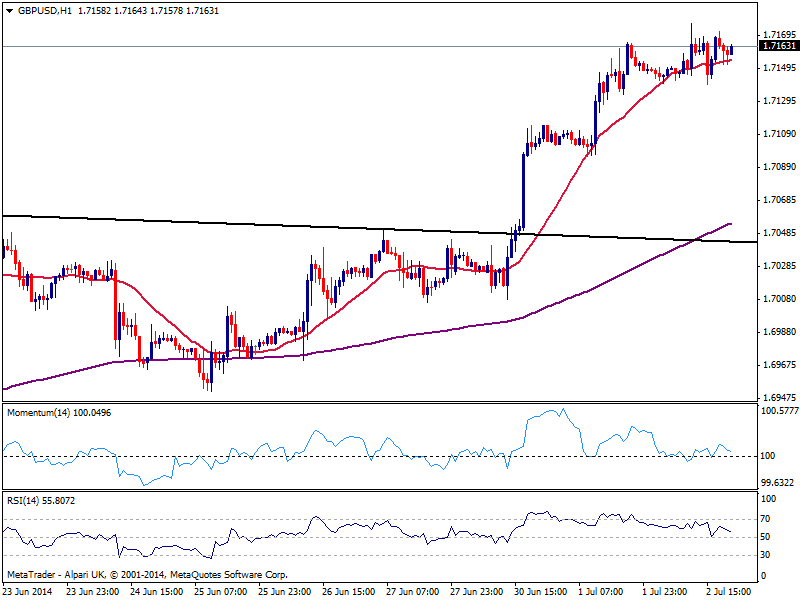
The GBP/USD posted its fifth day in a row with gains, reaching a 6-year high of 1.7176 with another round of positive UK data. The pair suffered little with dollar intraday strength, founding buyers on retracement towards 1.7130 price zone holding the positive tone in the short term, as per price steadied above its 20 SMA and indicators aiming now to bounce higher from their midlines. In the 4 hours chart the upward momentum seems stronger still looking for an advance beyond 1.7200. Beware dips will likely attract buyers as low as 1.7000/30 price zone, as employment figures need to be shockingly positive to revert current trend.
Support levels: 1.7130 1.7095 1.7060
Resistance levels: 1.7180 1.7220 1.7250
USD/JPY Current price: 101.81
View Live Chart for the USD/JPY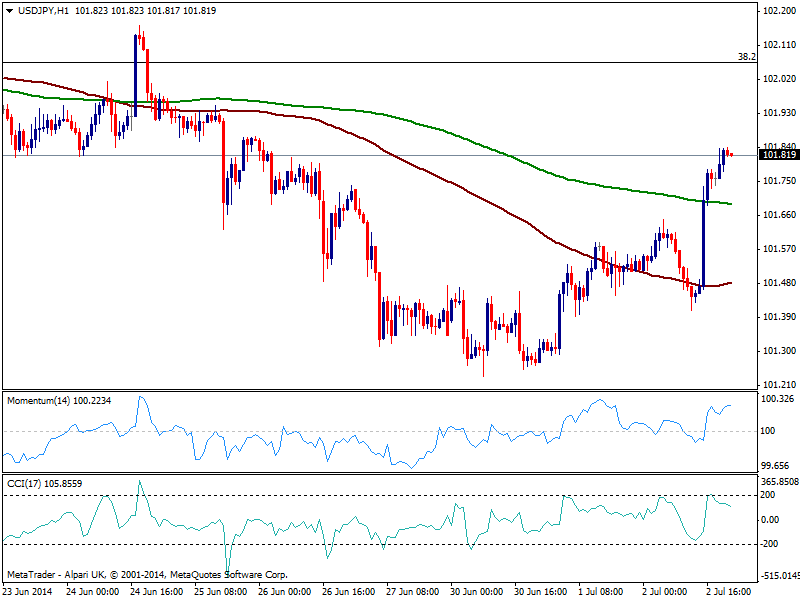
The USD/JPY advanced strongly before making a pause, having continued grinding higher in a quiet US afternoon and trading near a 4-day high. The hourly chart shows price overcame its 100 and 200 SMAs, while indicators stand near overbought levels, albeit price refuses to retrace. In the 4 hours chart technical readings present a clear bullish tone that supports a continued ride, eyeing as critical resistance the 102.80 price zone.
Support levels: 101.60 101.20 100.70
Resistance levels: 102.00 102.35 102.80
AUD/USD Current price: 0.9436
View Live Chart for the AUD/USD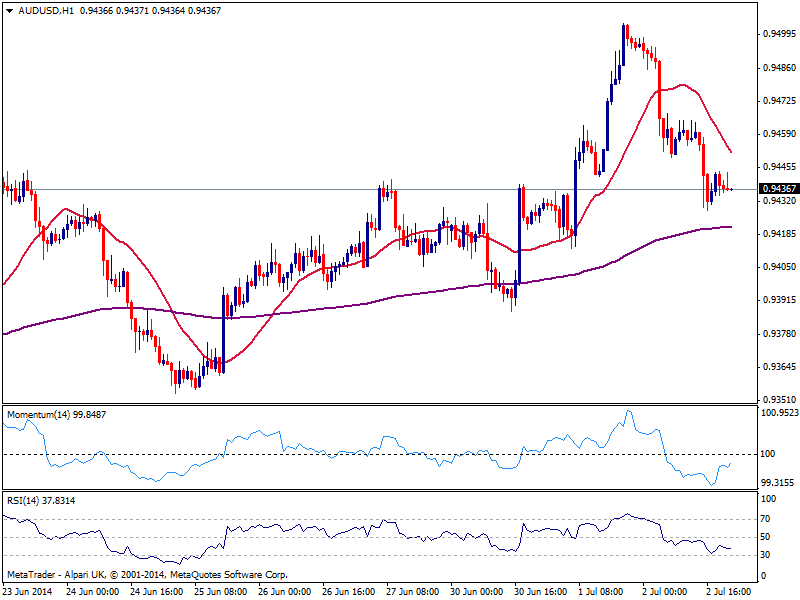
Worse than expected Australian Trade Balance hit Aussie, down to 0.9428 on the day against the greenback. The lack of action in commodities and stocks left the pair to its self will, starting a new day now with a mild bearish tone in the short term, as in the hourly chart price stands below its 20 SMA but momentum heads higher in negative territory. In the 4 hours chart latest candle opened below a flat 20 SMA but indicators stand in neutral territory, showing no actual strength at the time being. Below 0.9420 the pair may retest 0.9370 support, but it will be only below 0.9335 that bulls will begin to hesitate.
Support levels: 0.9420 0.9370 0.9335
Resistance levels: 0.9460 0.9500 0.9550
Recommended Content
Editors’ Picks
EUR/USD: Federal Reserve and Nonfarm Payrolls spell action this week

The EUR/USD pair temporarily reconquered the 1.0700 threshold last week, settling at around that round level. The US Dollar lost its appeal following discouraging United States macroeconomic data indicating tepid growth and persistent inflationary pressures.
GBP/USD retreats to 1.2500 on renewed USD strength

GBP/USD lost its traction and turned negative on the day near 1.2500. Following the stronger-than-expected PCE inflation readings from the US, the USD stays resilient and makes it difficult for the pair to gather recovery momentum.
Gold: Strength of $2,300 support is an encouraging sign for bulls

Gold price started last week under heavy bearish pressure and registered its largest one-day loss of the year on Monday. The pair managed to stage a rebound in the second half of the week but closed in negative territory.
Ethereum fees drops to lowest level since October, ETH sustains above $3,200

Ethereum’s high transaction fees has been a sticky issue for the blockchain in the past. This led to Layer 2 chains and scaling solutions developing alternatives for users looking to transact at a lower cost.
Week ahead – Hawkish risk as Fed and NFP on tap, Eurozone data eyed too

Fed meets on Wednesday as US inflation stays elevated. Will Friday’s jobs report bring relief or more angst for the markets? Eurozone flash GDP and CPI numbers in focus for the Euro.