COVID fears drags down markets [Video]
![COVID fears drags down markets [Video]](https://editorial.fxstreet.com/images/Macroeconomics/Events/Coronavirus/coronavirus2_XtraLarge.jpg)
US Dollar: Dec '20 USD Up at 92.680.
Energies: Nov'20 Crude is Down at 41.38.
Financials: The Dec '20 30 year bond is Up 21 ticks and trading at 173.06
Indices: The Dec S&P 500 emini ES contract is 60 ticks Lower and trading at 3550.00.
Gold: The Dec'20 Gold contract is trading Down at 1857.20 Gold is 167 ticks Lower than its close.
Initial Conclusion
This is not a correlated market. The dollar is Up+ and Crude is Down- which is normal and the 30 year Bond is trading Higher. The Financials should always correlate with the US dollar such that if the dollar is lower then bonds should follow and vice-versa. The S&P is Lower and Crude is trading Lower which is not correlated. Gold is trading Lower which is correlated with the US dollar trading Up+. I tend to believe that Gold has an inverse relationship with the US Dollar as when the US Dollar is down, Gold tends to rise in value and vice-versa. Think of it as a seesaw, when one is up the other should be down. I point this out to you to make you aware that when we don't have a correlated market, it means something is wrong. As traders you need to be aware of this and proceed with your eyes wide open.
Asia traded mainly Lower with the exception of the Shanghai exchange which is Higher. All of Europe is trading Lower at this time.
Possible Challenges To Traders Today:
-
Philly Fed Manufacturing Index is out at 8:30 AM EST. This is Major.
-
Unemployment Claims is out at 8:30 AM EST. This is Major.
-
CB Leading Index m/m is out at 10 AM EST. This is Major.
-
Existing Home Sales is out at 10 AM EST. This is Major.
-
Natural Gas Storage is out at 10:30 AM EST. This is Major.
Treasuries
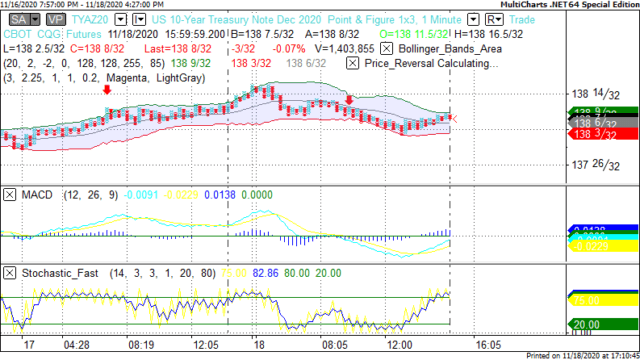
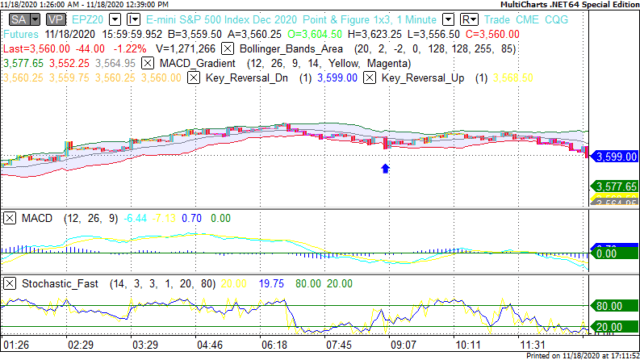
Traders please note that we've changed the Bond instrument from the 30 year (ZB) to the 10 year (ZN). They work exactly the same.
We've elected to switch gears a bit and show correlation between the 10 year bond (ZN) and The S&P futures contract. The S&P contract is the Standard and Poor's and the purpose is to show reverse correlation between the two instruments. Remember it's liken to a seesaw, when up goes up the other should go down and vice versa.
Yesterday the ZN made it's move at around 9 AM EST. The ZN hit a High at around that time and the S&P moved Higher. If you look at the charts below ZN gave a signal at around 9 AM EST and the S&P moved Higher at around the same time. Look at the charts below and you'll see a pattern for both assets. ZN hit a High at around 9 AM EST and the S&P was moving Higher shortly thereafter. These charts represent the newest version of MultiCharts and I've changed the timeframe to a 15 minute chart to display better. This represented a Shorting opportunity on the 10 year note, as a trader you could have netted about 20 ticks per contract on this trade. Each tick is worth $15.625. Please note: the front month for the ZN is now Dec '20. The S&P contract is also Dec '20 as well. I've changed the format to Renko bars such that it may be more apparent and visible.
Charts Courtesy of MultiCharts built on an AMP platform
Bias
Yesterday we gave the markets an Upside bias as the USD was trading Lower as was Gold and this usually reflects an Upside day. The markets however had other ideas as the the Dow dropped 345 points and the other indices lost ground as well. Today we aren't dealing with a correlated market and our bias is to the Downside.
Could this change? Of Course. Remember anything can happen in a volatile market.
Commentary
Yesterday we awoke to what we thought would be an ordinary day in the markets. We gave an Upside bias as both the USD and the Gold were trading Lower and that usually reflects an Upside day. By mid afternoon it became apparent that the markets would trade Lower and the reason we suspect that this was the case was fear over the increase of Covid 19 cases and unfortunately deaths. I watched on TV as Governor Andrew Cuomo of New York sized up the situation and gave his assessment and it wasn't good. It reminded me of the speeches he gave in March when New York was originally dealing with Covid 19 originally. Today we have 5 economic reports, all of which are major and have the ability to drive the markets Higher. Will they? Only time will tell.
Author

Nick Mastrandrea
Market Tea Leaves


