Chart of the Week: US dollar in focus at demand area, forex hoping for spike in volume
- DXY is in a phase of accumulation in consolidated markets.
- The week ahead will be key for the US dollar and volatility could pick up soon.

The US dollar is a keen focus for the week ahead.
The US Dollar Index (DXY), which gauges the greenback versus a basket of its main competitors, is in a phase of accumulation, and there could be a much-needed pickup in volatility ahead.
As it stands, forex volatility is at its lowest in over a year:
-637592210358005488.jpeg)
Monthly chart
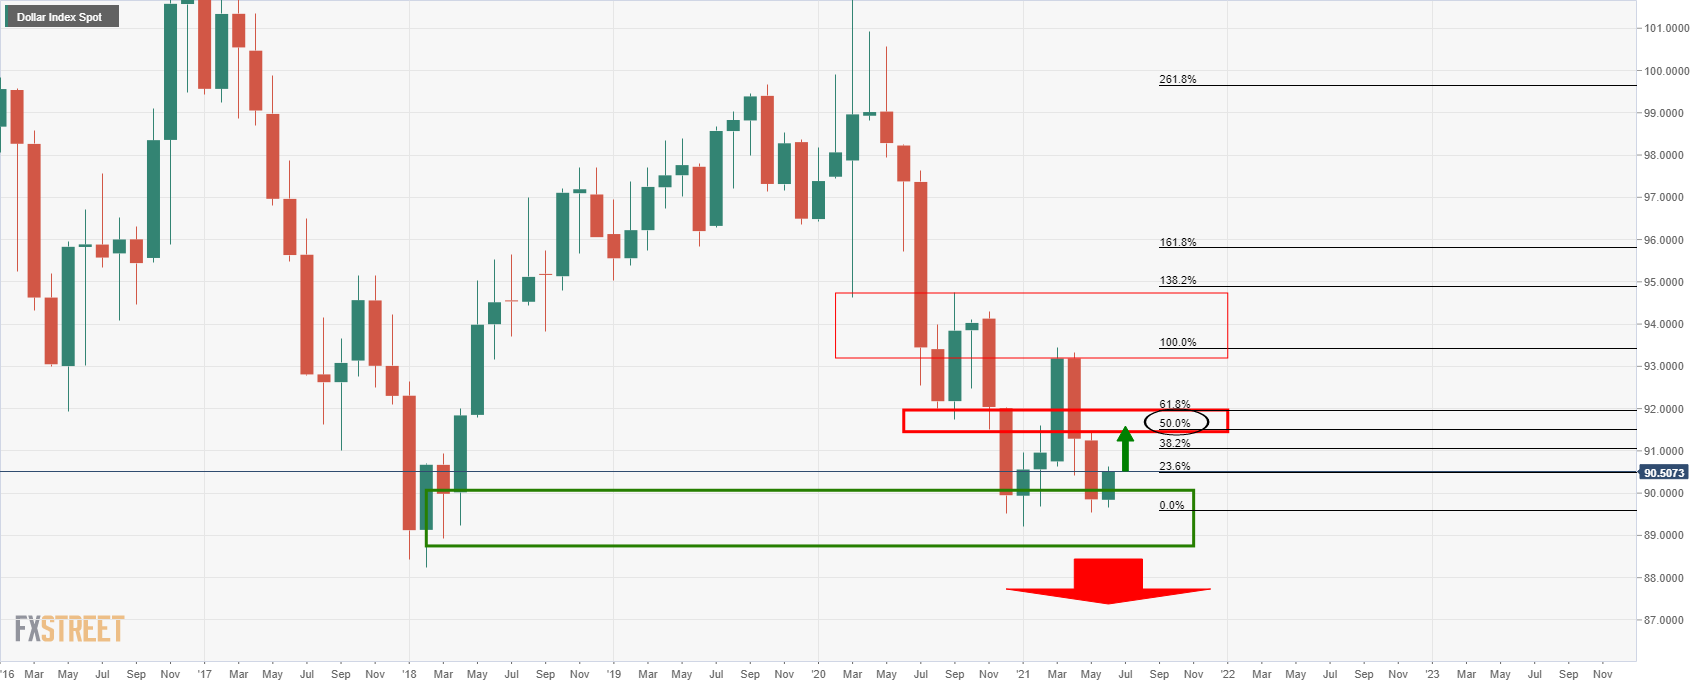
The US dollar is firming at the monthly support area and would be expected to continue doing so until at least a strong retest of the near term resistance and the 50% mean reversion of the latest bearish impulse.
Weekly chart
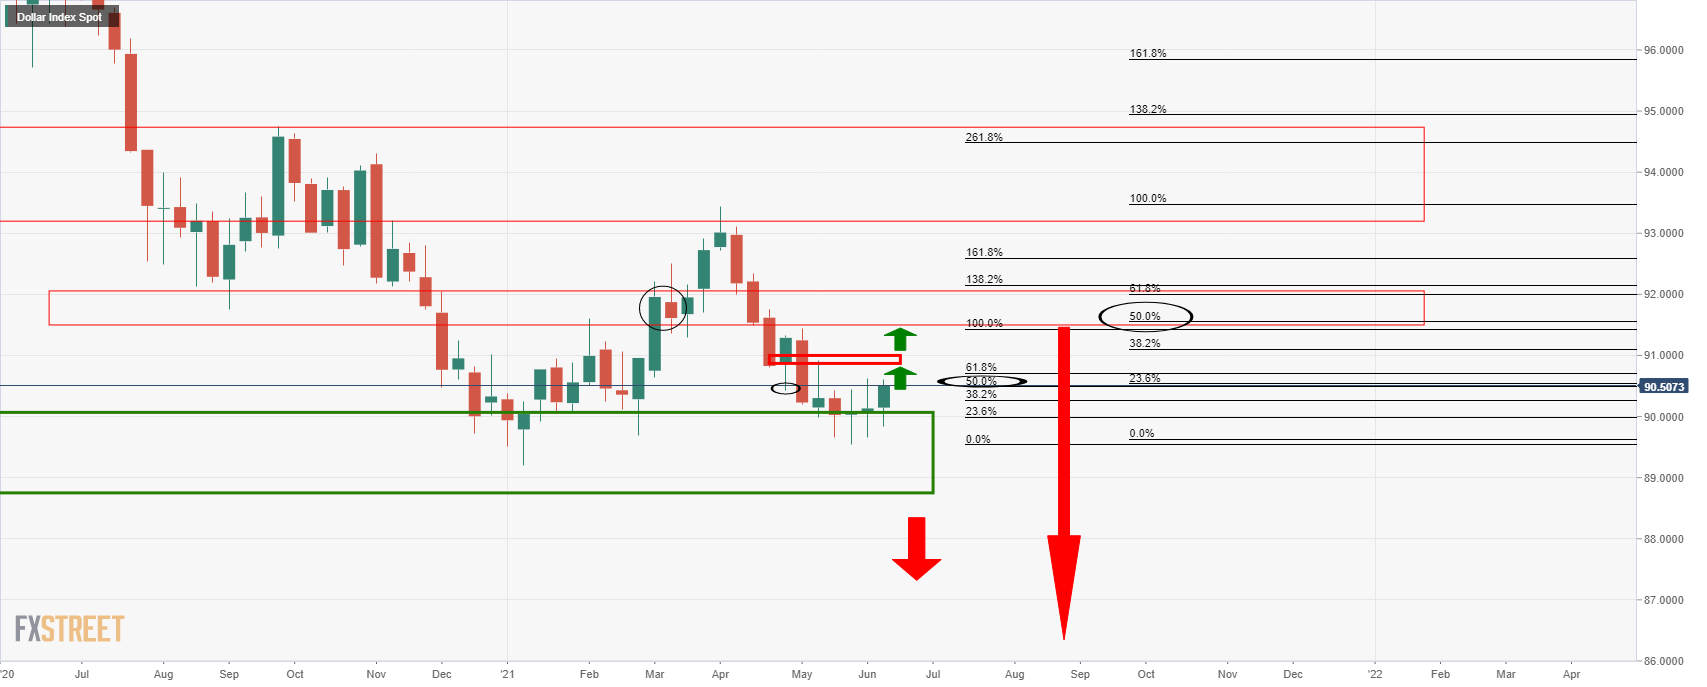
The weekly chart illustrates the bullish bias for the near term from monthly/weekly support.
There are a number of market structures worth noting on the way to the monthly 50% mean reversion target.
The weekly 38.2% Fibo has a confluence with old support that could prove challenging for the bulls prior to a test of the resistances higher up.
Daily chart
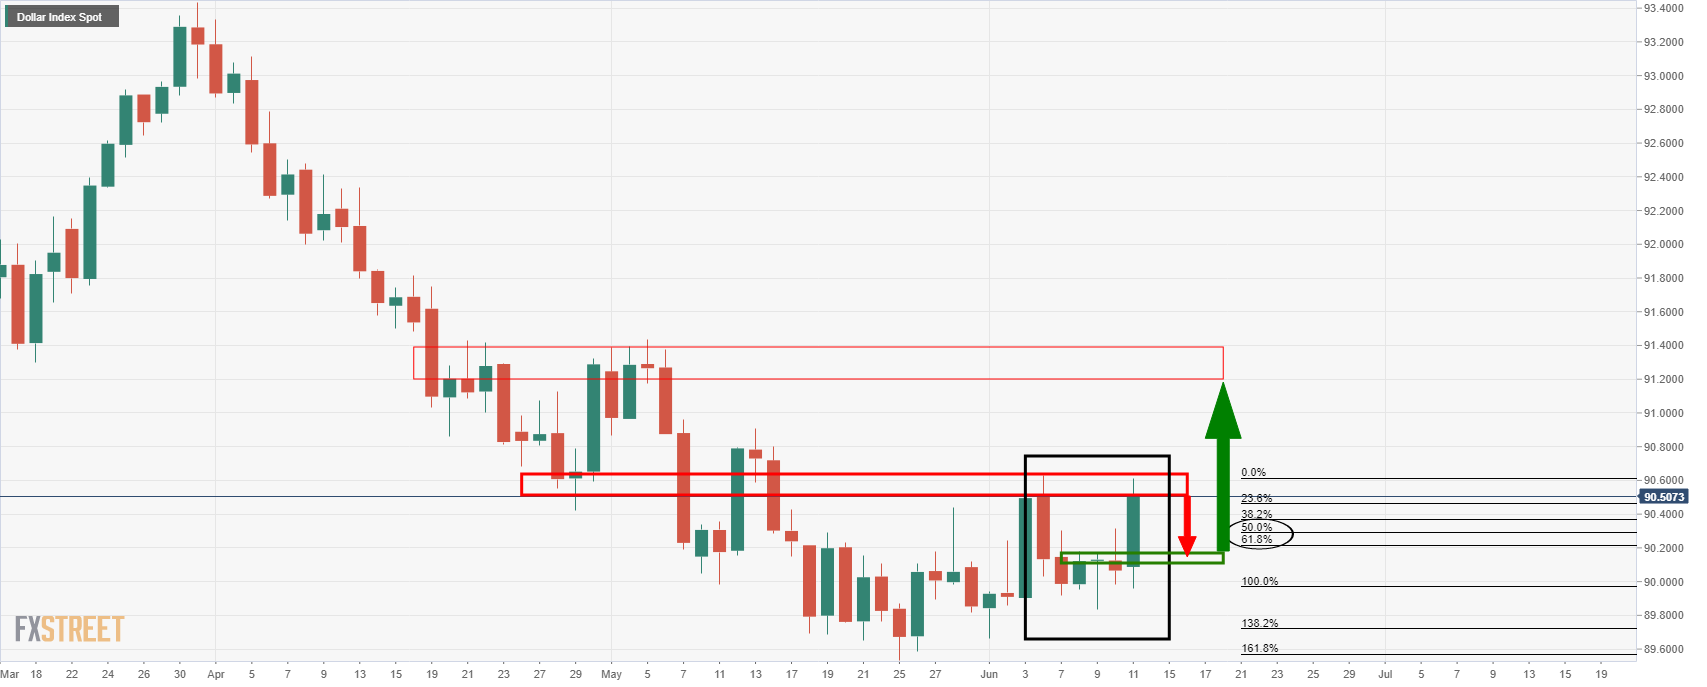
The W-formation is a bearish pattern within this phase of accumulation.
The neckline of the formation would be expected to act as support prior to the next leg higher.
4-hour chart
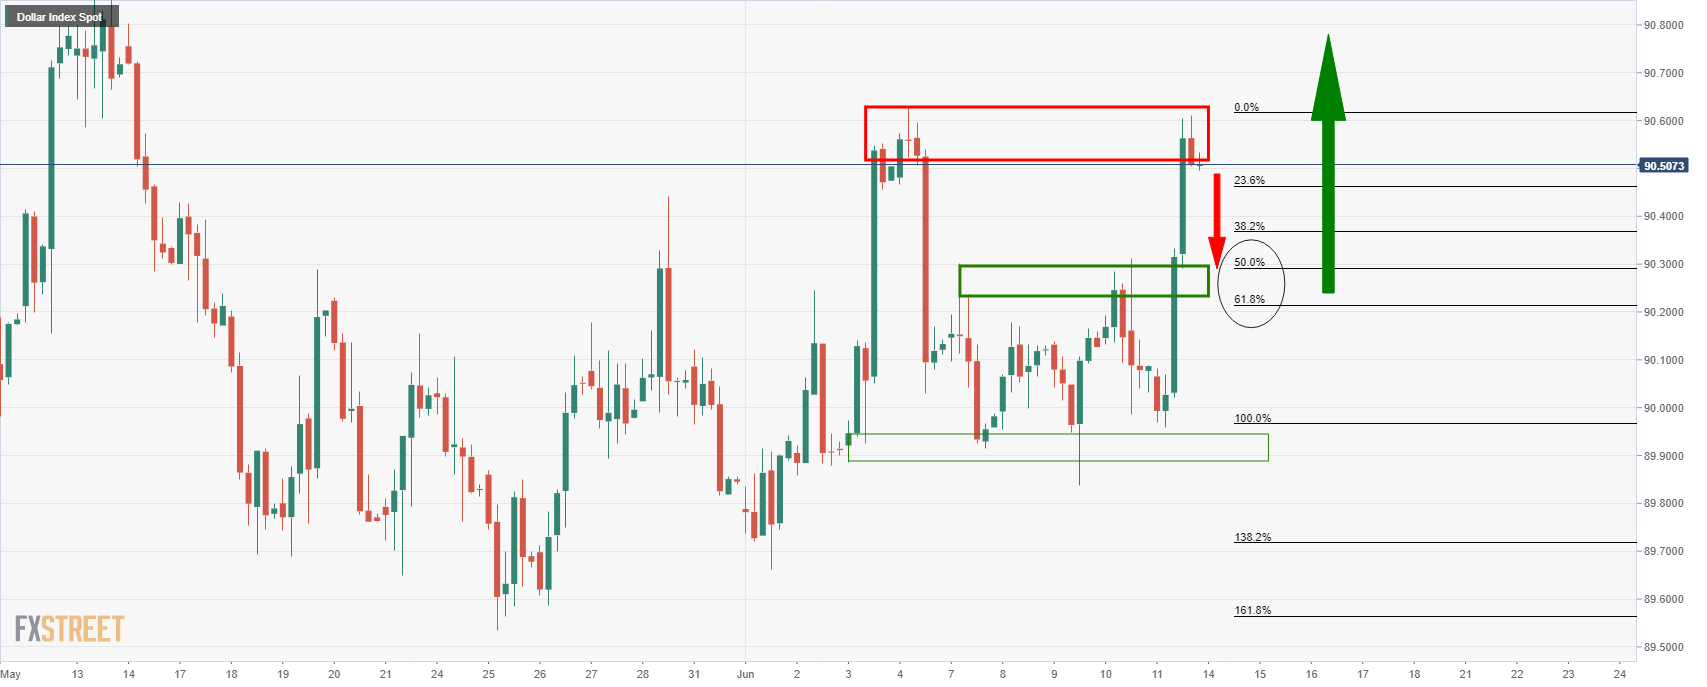
The DXY is capped at the resistance zone and would be expected to retrace the rally to retest old highs.
Hourly chart
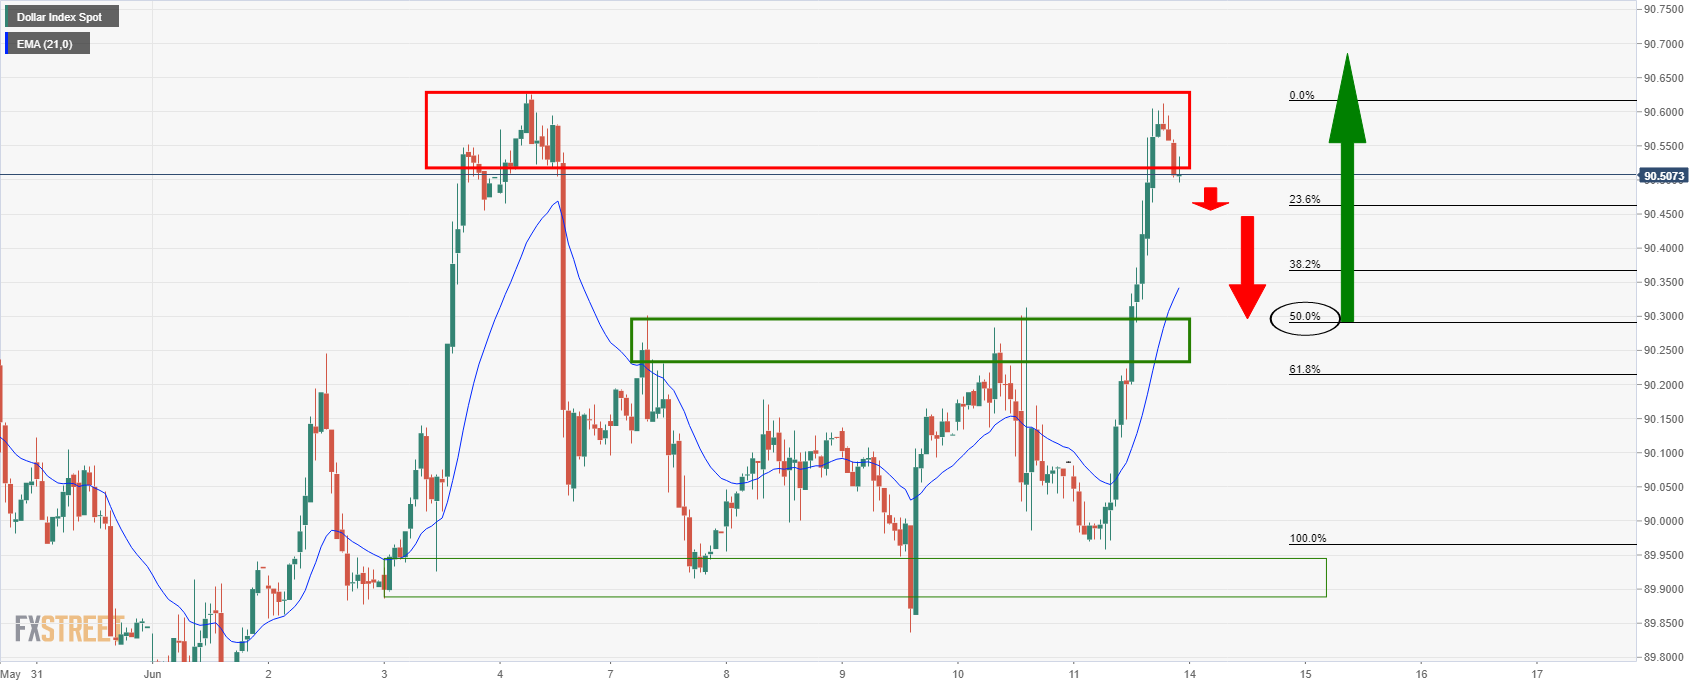
The bears are in control for the open with the price en route for a restest of the prior resistance where a confluence of the 21-hour EMA and the 50% mean reversion level meet.
Author

Ross J Burland
FXStreet
Ross J Burland, born in England, UK, is a sportsman at heart. He played Rugby and Judo for his county, Kent and the South East of England Rugby team.


