![]() Austin Galt
Austin Galt
The Voodoo Analyst
The Dow just keeps plugging higher but all good things must eventually end so let’s review the daily chart to see where the good times are likely to end.
DOW DAILY CHART
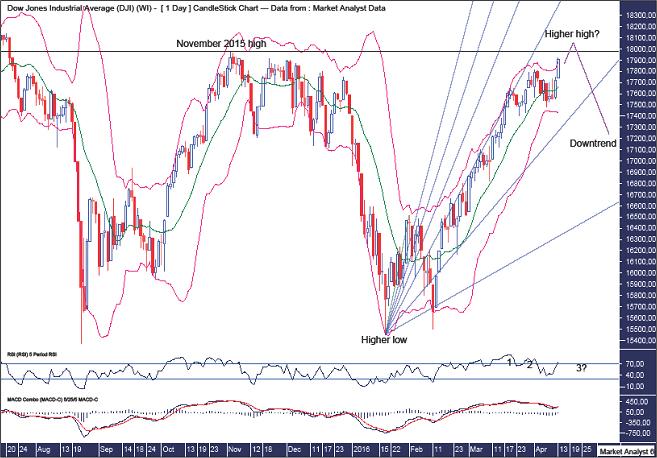
The Fibonacci fan show the move higher over the last couple of months has generally been contained within the 61.8% and 76.4% angles. It is only recently that price has started to drift away from the 61.8% angle indicating some weariness creeping into to the uptrend. Nevertheless, price to continues to climb the wall of worry.
So, where is this uptrend likely to terminate?
The horizontal line denotes the November 2015 high at 17977 and I believe price is set to make a false break top just above that level.
The low in January 2015 was a higher low and should price trade above the November 2015 high then it will be followed by a higher high. After that I expect a bold move back down that eventually sets up another higher low. As outlined in previous analysis, I am targeting around the 15700 level for that higher low.
The Bollinger Bands show price having one last lash at the upper band which should see price push further into this band before a reversal back down takes place.
The RSI looks likely to set up a triple bearish divergence on this next high. That often leads to a significant move down and that is certainly my expectation.
The MACD is currently marginally bullish but should set up a bearish divergence on the coming high.
So, a high appears imminent but, as far as I’m concerned, this is not the beginning of the next leg down in a big bear market. However, by the time the next higher low forms it will certainly feel like it.
The above is a matter of opinion provided for general information purposes only and is not intended as investment advice. Information and analysis above are derived from sources and utilising methods believed to be reliable, but we cannot accept responsibility for any losses you may incur as a result of this analysis. Individuals should consult with their personal financial advisors. Put simply, it is JUST MY OPINION.
Recommended Content
Editors’ Picks
EUR/USD eases to near 1.0700 ahead of German inflation data

EUR/USD is paring gains to near 1.0700 in the European session on Monday. The pair stays supported by a softer US Dollar, courtesy of the USD/JPY sell-off and a risk-friendly market environment. Germany's inflation data is next in focus.
USD/JPY recovers after testing 154.50 on likely Japanese intervention

USD/JPY is recovering ground after sliding to 154.50 on what seemed like a Japanese FX intervention. The Yen tumbled in early trades amid news that Japan's PM lost 3 key seats in the by-election. Focus shifts to the US employment data and the Fed decision later this week.
Gold price holds steady above $2,335, bulls seem reluctant amid reduced Fed rate cut bets

Gold price (XAU/USD) attracts some buyers near the $2,320 area and turns positive for the third successive day on Monday, albeit the intraday uptick lacks bullish conviction.
Ripple CTO shares take on ETHgate controversy, XRP holders await SEC opposition brief filing

Ripple loses all gains from the past seven days, trading at $0.50 early on Monday. XRP holders have their eyes peeled for the Securities and Exchange Commission filing of opposition brief to Ripple’s motion to strike expert testimony.
Week ahead: FOMC and jobs data in sight

May kicks off with the Federal Open Market Committee meeting and will be one to watch, scheduled to make the airwaves on Wednesday. It’s pretty much a sealed deal for a no-change decision at this week’s meeting.