AUD/USD Forecast: Decent contention remains near 0.6500
- AUD/USD navigated a narrow range in the low 0.6500s.
- The better tone in the Greenback put the pair under pressure.
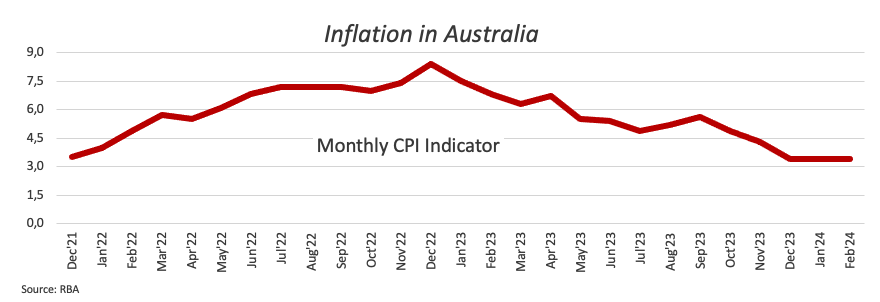
- Australian inflation held steady at 3.4% in February.

The slight upward pressure on the US Dollar (USD) prompted a similarly tepid retreat in AUD/USD on Wednesday, holding the pair around 0.6530 and adding to Tuesday’s pullback.
Although the USD's movements continued to govern the pair's dynamics, the lack of buying interest in copper and iron ore prices also played a role in the subdued movement in spot midweek.
Additionally, the economic conditions in China are expected to influence the Australian Dollar (AUD) as well. While potential stimulus actions from the government and the PBoC might offer temporary relief, sustained improvements in economic indicators are required to strengthen the Australian currency and possibly initiate a significant upward trend in AUD/USD.
Meanwhile, AUD/USD appears to have absorbed the dovish stance from the Reserve Bank of Australia (RBA) following its decision to keep the OCR unchanged at 4.35% during its March 19 meeting. It's worth noting that the RBA is among the last G10 central banks projected to contemplate interest rate adjustments this year.
The above was also underpinned by stick inflation figures tracked by the RBA’s Monthly CPI Indicator, which showed an advance of 3.4% in February, matching the January and December readings.
Considering the divergent timelines for monetary policy adjustments between the RBA and the Fed, the Australian dollar might gather momentum later in the year, potentially leading to further appreciation in AUD/USD. If the pair surpasses the December 2023 peak of 0.6871, it could aim for a significant level of 0.7000 in the near future.
AUD/USD daily chart
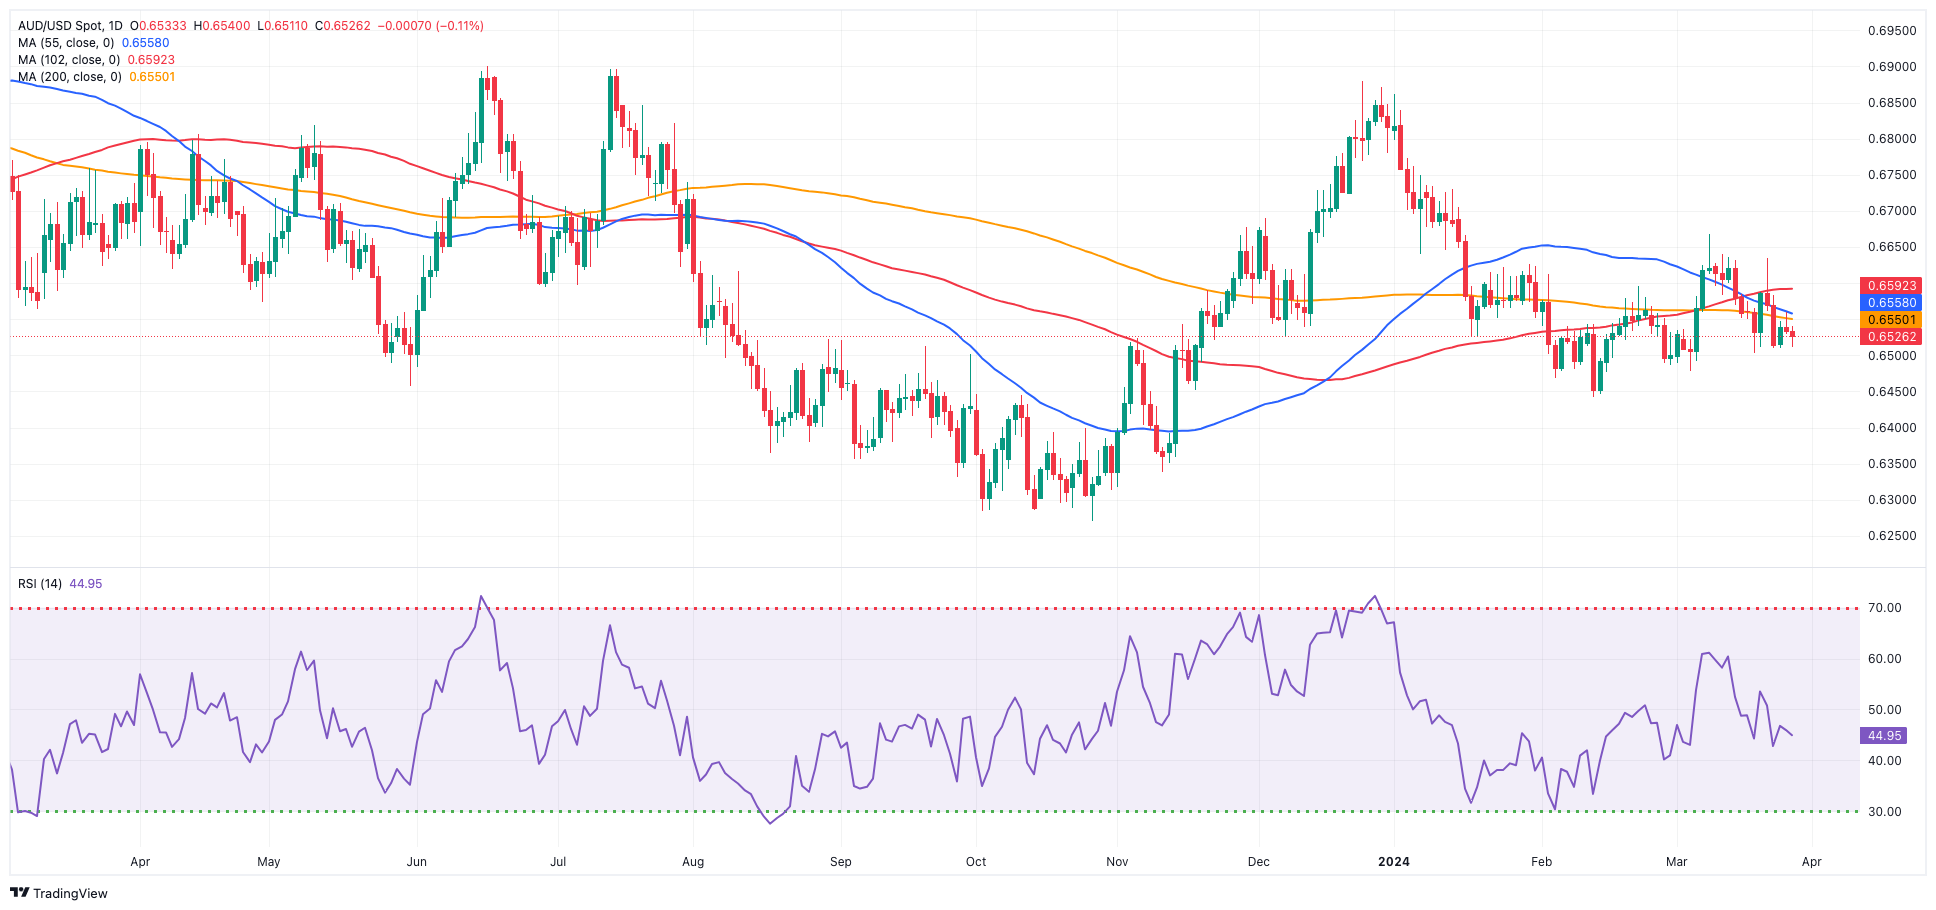
AUD/USD short-term technical outlook
Further upward momentum in AUD/USD faces provisional barrier at the 100-day SMA at 0.6590 prior to the March peak of 0.6667 (March 8) and the December 2023 high of 0.6871 (December 28). The breakout of this level could expose a move to monthly tops of 0.6894 (July 14) and 0.6899 (June 16), all before the critical 0.7000 barrier.
If sellers regain control, the pair could hit a weekly low of 0.6503 (March 19). Once this zone is cleared, spot might return to the March low of 0.6477 (March 5), followed by the 2024 low of 0.6442 (February 13). Breaking below this level may lead to a test of the 2023 low of 0.6270 (October 26), followed by the round level of 0.6200 and the 2022 low of 0.6169 (October 13).
Looking at the big picture, the pair is projected to restore its bullish momentum once it decisively surpasses the crucial 200-day SMA of 0.6548.
On the 4-hour chart, the pair appears to have regained its upward momentum. Against this, there is temporary resistance at the 100-SMA of 0.6566, which is ahead of 0.6634, followed by 0.6638 and 0.6667. However, fresh losses may drive the pair to revisit 0.6509, then 0.6503, 06477, and finally 0.6442. Furthermore, the MACD remained somewhat bearish, with the RSI rising beyond 45.
Premium
You have reached your limit of 3 free articles for this month.
Start your subscription and get access to all our original articles.
Author

Pablo Piovano
FXStreet
Born and bred in Argentina, Pablo has been carrying on with his passion for FX markets and trading since his first college years.


