Another Sell-Off Expected

The stock market is expected to accelerate the short-term downtrend today following Wednesday's one-day pause as investors' sentiment worsened once again. Will the S&P 500 index get back to its late October low?
The U.S. stock market indexes lost 3.1-3.8% on Tuesday, retracing some of their recent advance, as investors' sentiment quickly worsened following the renewed trade war fears. The S&P 500 index trades 8.2% below September the 21st record high of 2,940.91. The Dow Jones Industrial Average lost 3.1% and the Nasdaq Composite lost 3.8% on Tuesday.
The broad stock market quickly reversed its last week's upward course following the S&P 500 index' reversal off the resistance level at 2,800. The market got back to 2,700 mark, as it retraced some of its recent rally. On Tuesday we wrote that it still looks like a two-month-long consolidation following the October rout. That statement remains relevant. The market is extending its medium-term consolidation, as we can see on the daily chart:

Very Negative Expectations
Expectations before the opening of today's trading session are negative, because the index futures contracts trade 2.2-2.3% below their Tuesday's closing prices. The European stock market indexes have lost 2.5% so far. Investors will wait for some economic data announcements today: Initial Claims, Trade Balance, Nonfarm Productivity at 8:30 a.m., ISM Non-Manufacturing PMI, Factory Orders at 10:00 a.m., Crude Oil Inventories at 10:30 a.m. There will also be a speech from the Fed Chair Powell later in the day. The broad stock market will likely accelerate its short-term downtrend today. The S&P 500 index will probably reach the October-November local lows of around 2,600-2,630. If it breaks lower, we could see further sell-off. However, for now it still looks like a volatile medium-term consolidation following the October decline.
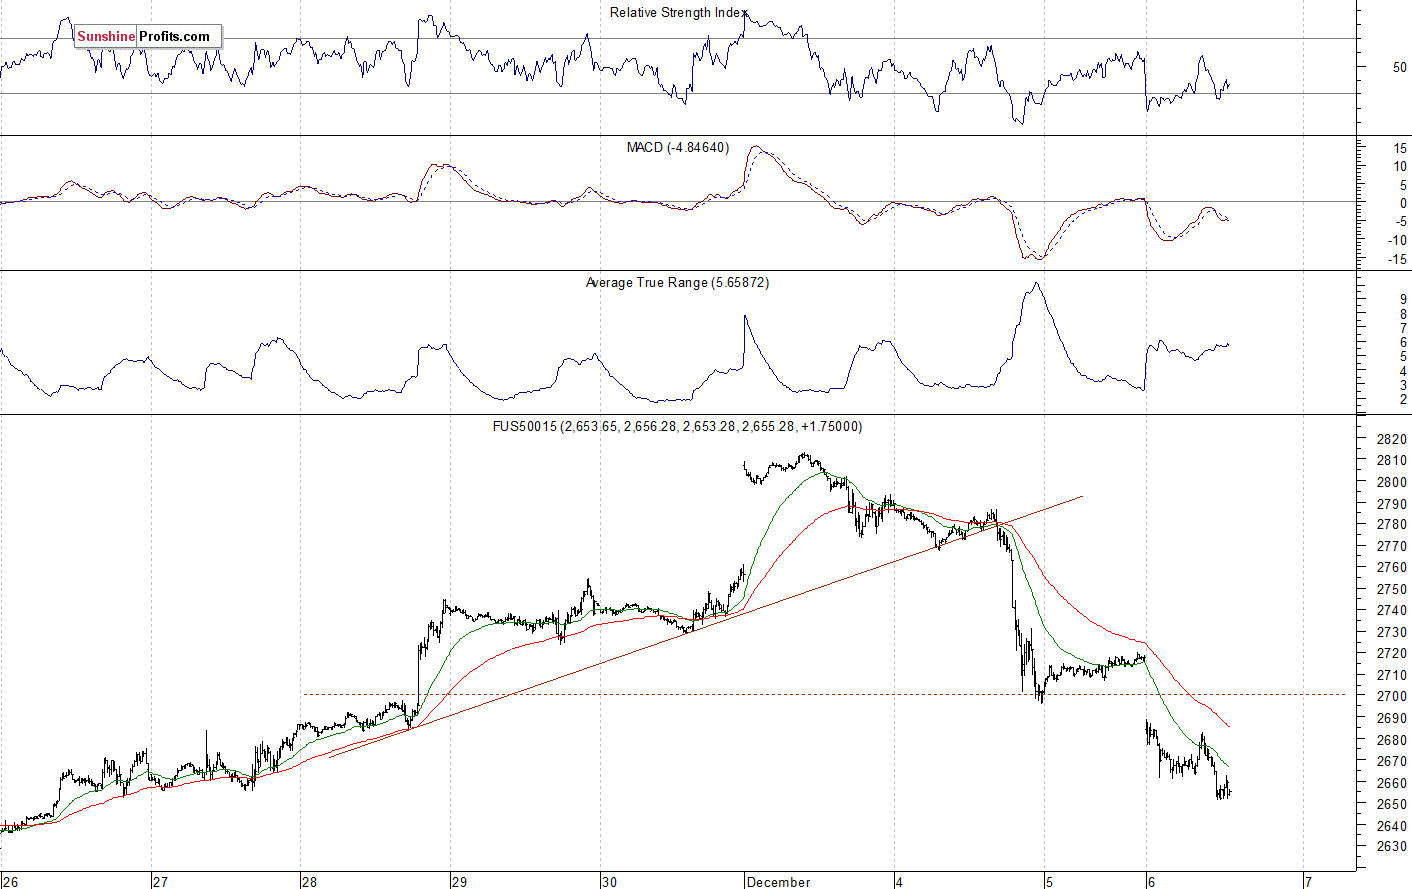
The S&P 500 futures contract trades within an intraday downtrend, as it retraces an overnight rebound following much lower opening of the trading session. The nearest important level of support is at around 2,625-2,650. On the other hand, the resistance level remains at 2,680- 2,700. The futures contract broke below the level of 2,700, as the 15-minute chart shows:
Nasdaq Also Much Lower
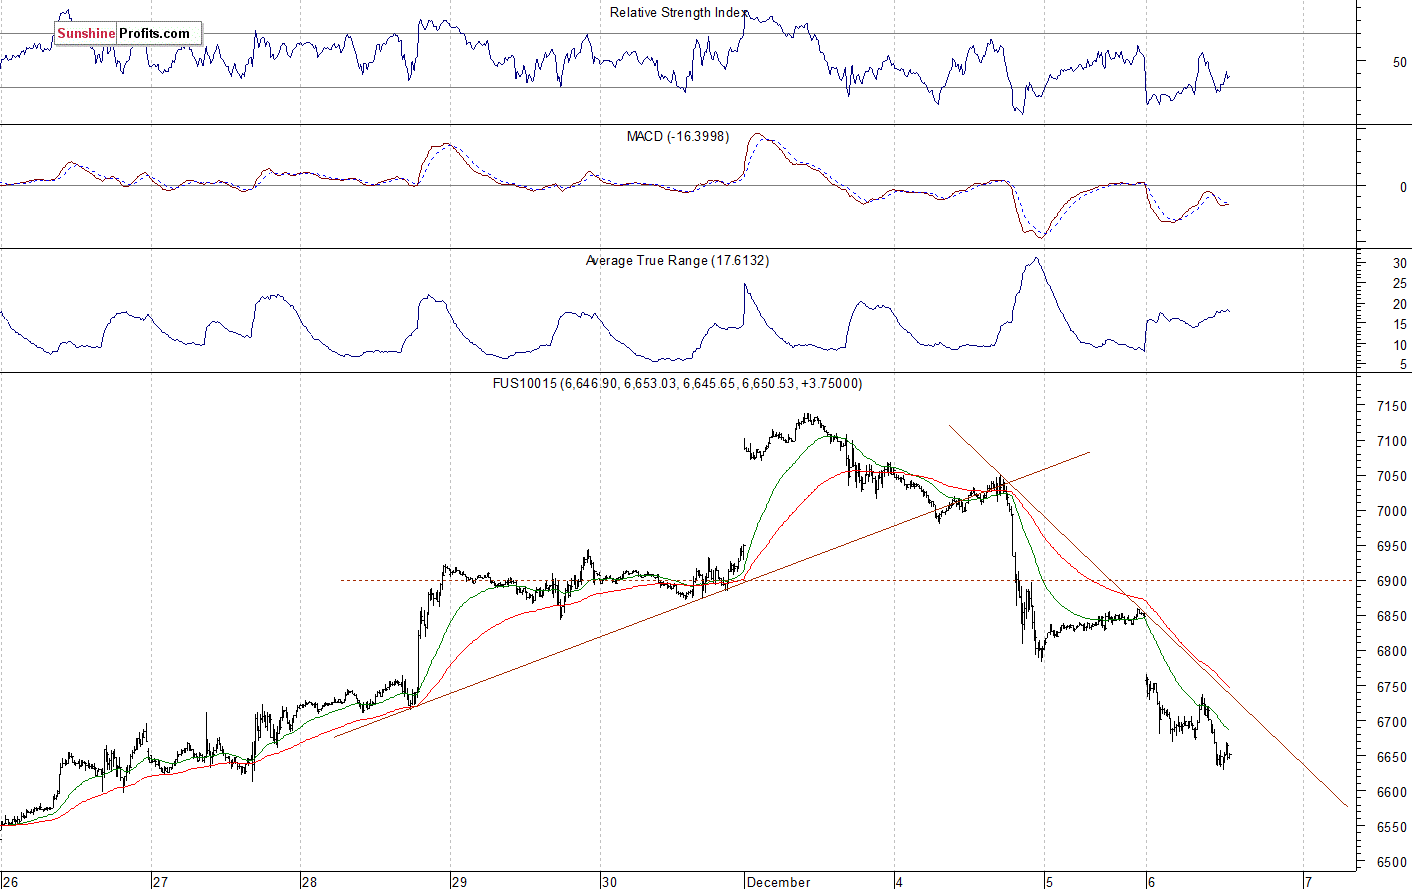
The technology Nasdaq 100 futures contract follows a similar path, as it trades within an intraday downtrend. The market keeps retracing its late November advance. It broke above 7,100 on Monday, and it was the highest since the early November. But then it quickly reversed lower. The nearest important level of resistance is now at around 6,700-6,750. On the other hand, the level of support is at 6,500-6,600, among others. The Nasdaq futures contract trades below the short-term downward trend line, as we can see on the 15-minute chart:
Apple, Amazon - Short-Term Downward Reversals
Let's take a look at Apple, Inc. stock (AAPL) daily chart. The stock accelerated its sell-off in the late November following the earlier breakdown below the support level of $185-190. The market has reached a short-term bottom of around $170-175. It rallied last week, as it closed slightly above the month-long downward trend line. Then it reversed the uptrend following bouncing off the resistance level of $185. We may see another attempt at extending the downtrend here:

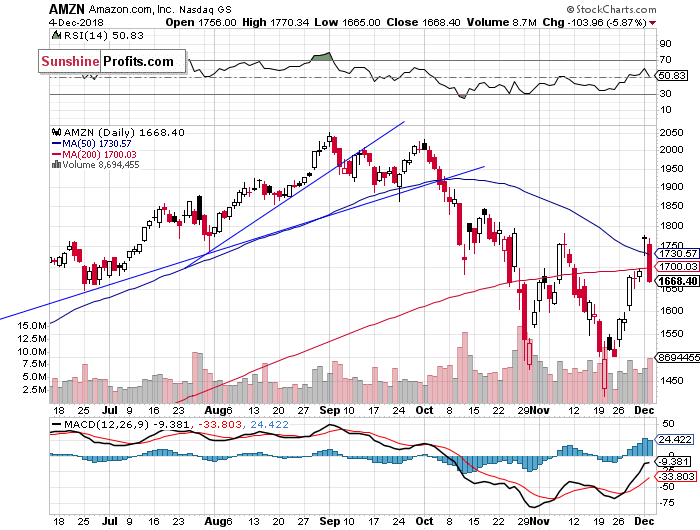
Now let's take a look at Amazon.com, Inc. stock (AMZN) daily chart. It was relatively stronger recently, as it retraced some more of the recent sell-off. Earlier, the stock fell closer to the price of $1,400, before rebounding off the support level. Then the market got back above the resistance level of $1,500, and it accelerated higher last week. The nearest important resistance level remains at $1,800, marked by some previous local highs. The stock reached its early November local high on Monday, and then it reversed lower. It will likely retrace more of the advance today:
Dow Jones at 25,000 Mark Again
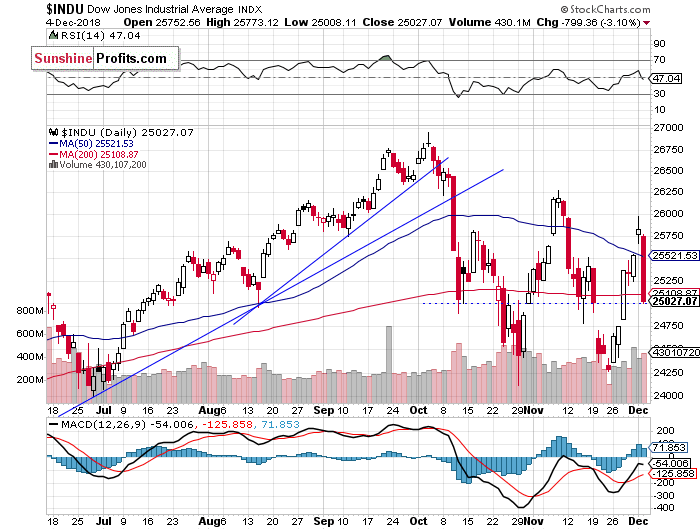
The Dow Jones Industrial Average broke above 25,000 mark last week, as it accelerated its short-term uptrend. The market continued towards the early November highs of 26,000- 26,250. Then it quickly reversed lower on Tuesday. We may see more downward action today. The index will likely get back below 25,000 mark:
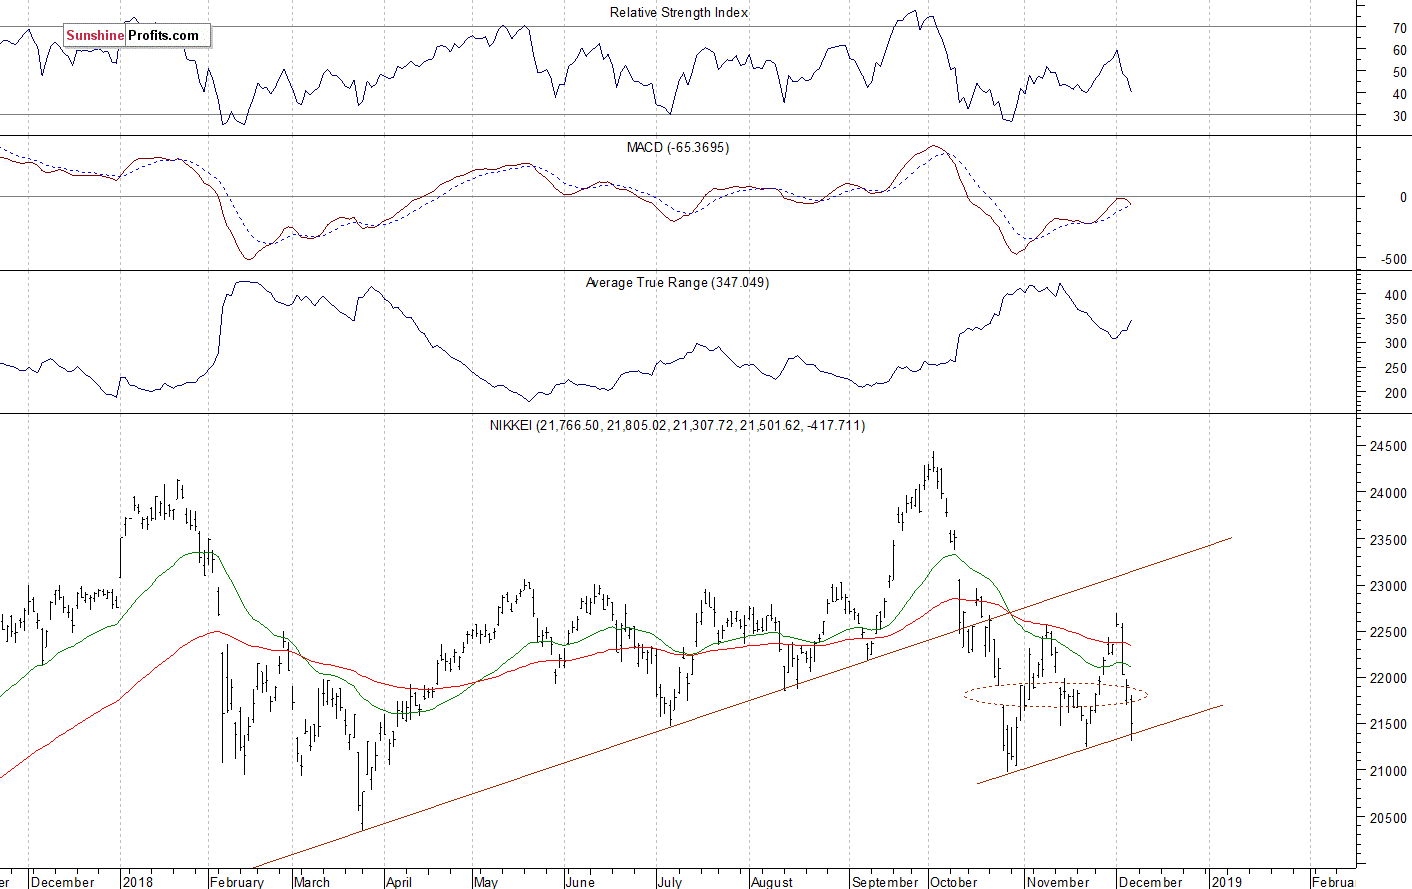
Japanese Nikkei Also Selling Off
Let's take a look at the Japanese Nikkei 225 index. It got back to its two-month-long upward trend line today. For now, the market continues to trade within a medium-term bear flag pattern. If it breaks lower, we could see more selling pressure:
The S&P 500 index quickly reversed its short-term uptrend on Tuesday following some negative U.S. - China trade war developments. It got back to 2,700 mark. And today we could see another wave of selling. The market may reach its October - November local lows. It still looks like a volatile medium-term consolidation. Concluding, the S&P 500 index will likely open much lower today. We may see some increased short-term volatility, as investors await the important economic data releases.
Want free follow-ups to the above article and details not available to 99%+ investors? Sign up to our free newsletter today!
Author

Paul Rejczak
Sunshine Profits
Paul Rejczak is a stock market strategist who has been known for the quality of his technical and fundamental analysis since the late nineties.


