I have opted for a keep-it-simple approach for oil (WTI) today.
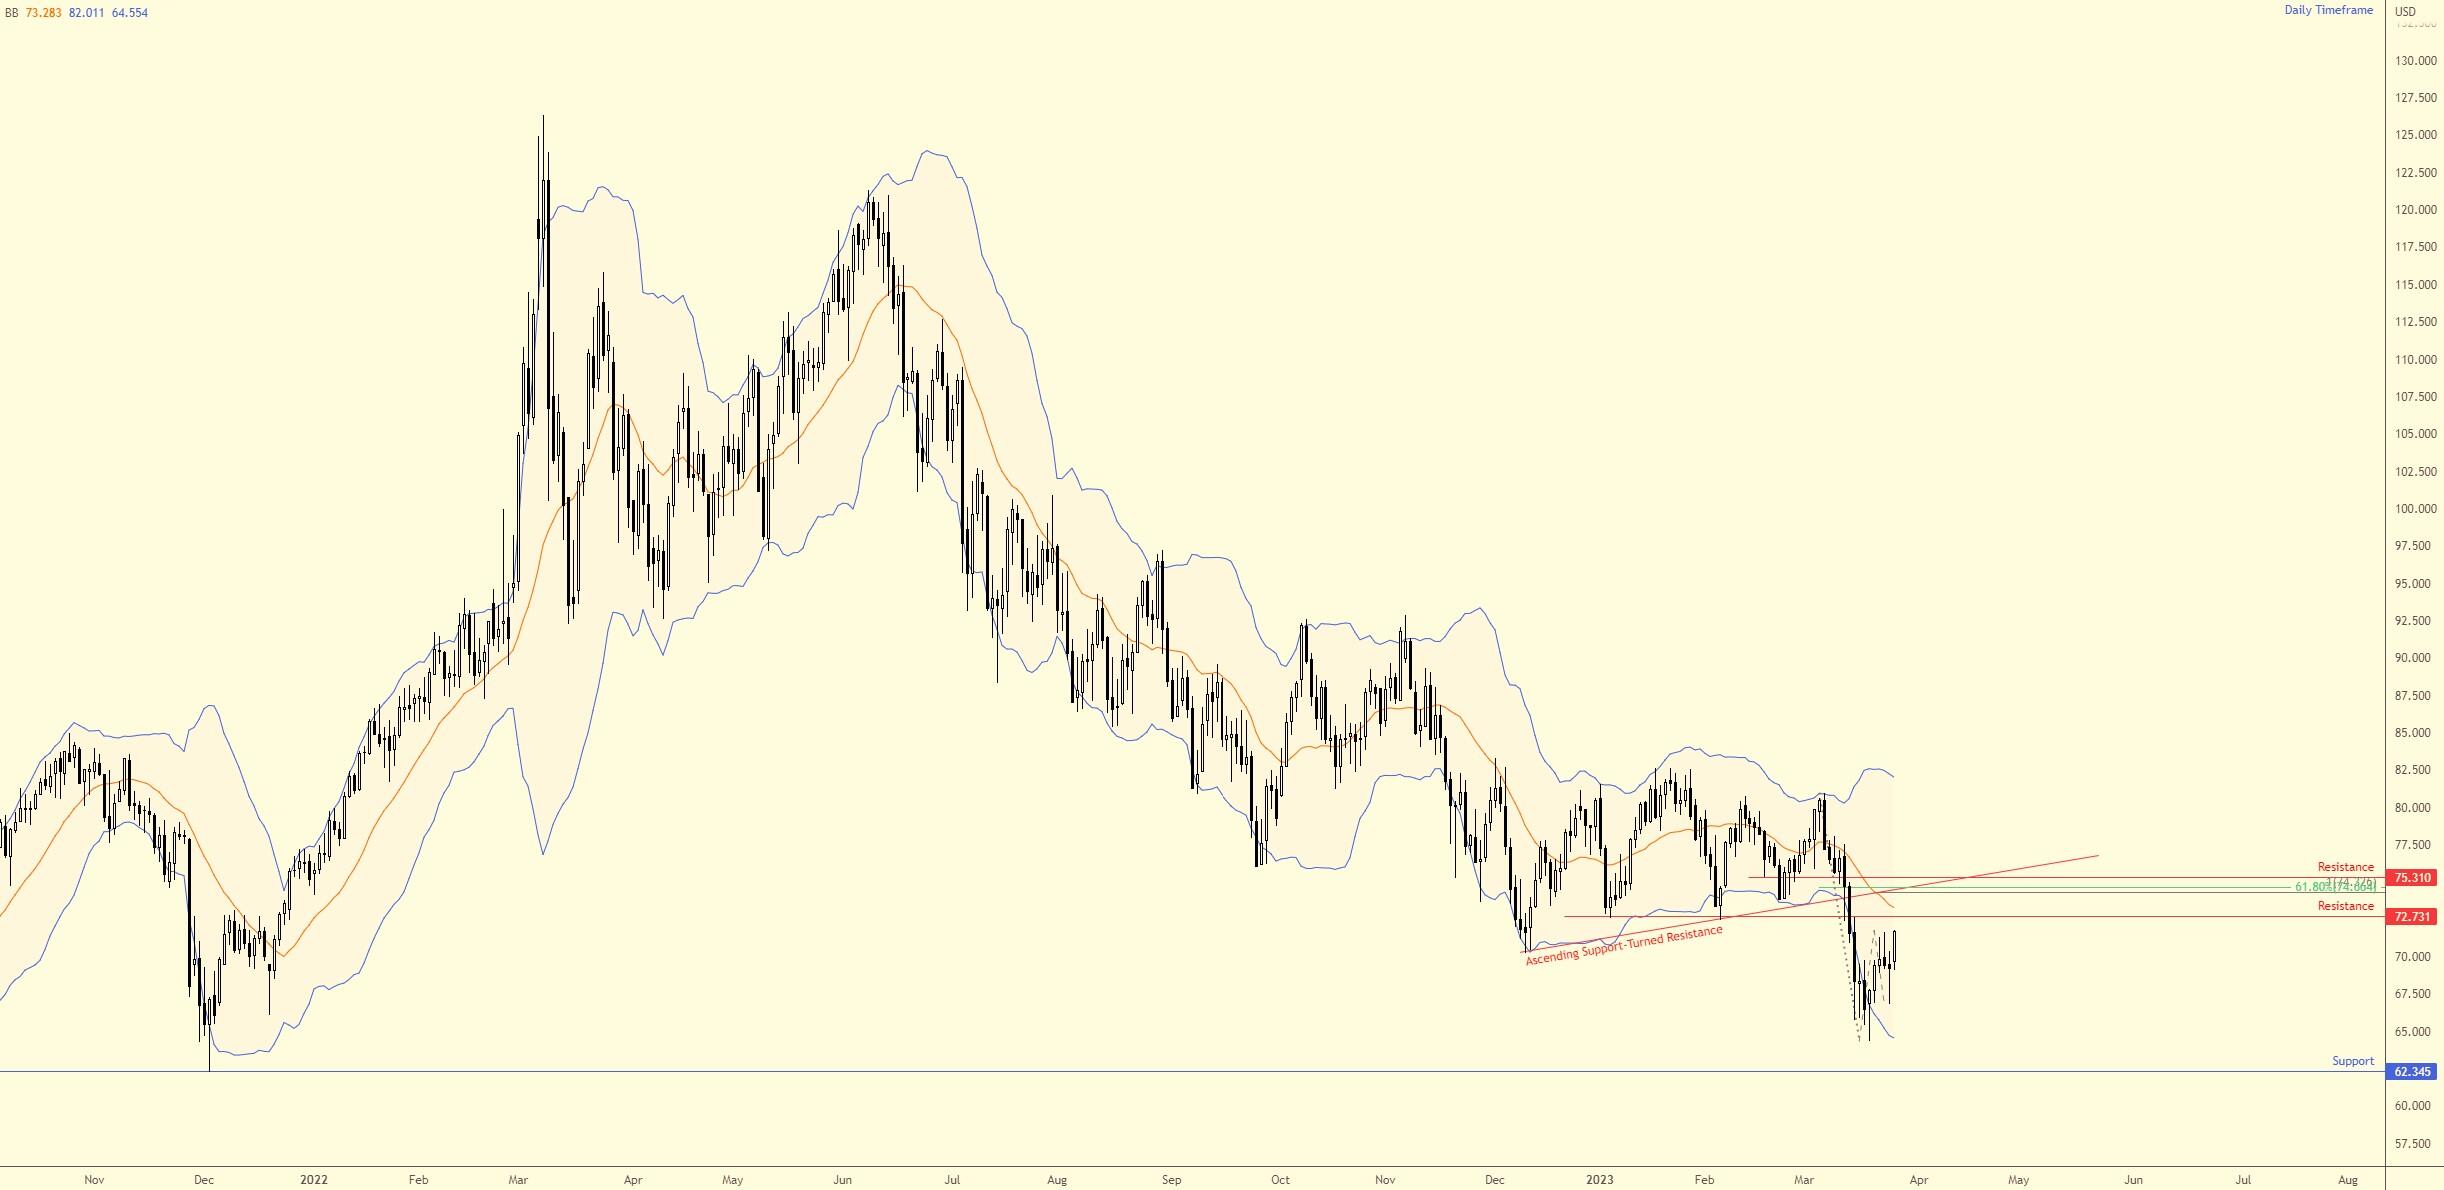
As you can see on the daily timeframe, we have been working with a defined downtrend in oil since price chalked up a top at $121.31/bbl in June 2022. Interestingly, the downtrend offered several sell-on-rally scenarios should one have faded the lower side of the upper Bollinger Band (set to 2 standard deviations using the default 20-period simple moving average).
AB=CD Pattern Unfolding on the Daily Chart?
Early last week witnessed price movement probe lows of $64.35, a move that came within striking distance of clipping the $62.31 2 December low (2021) and also invaded territory outside the lower Bollinger Band. Since then, we have observed a moderate recovery unfold, moulding what many Harmonic traders will recognise as a potential AB=CD bearish formation (price is currently forming the D-leg).
Overhead Technical Confluence in View
Joining the 100% projection at $74.33 (which marks the AB=CD resistance), chart studies have thrown the following technical structure in the mix: an ascending support-turned-resistance taken from the low $70.24, a 61.8% Fibonacci retracement at $74.66, two horizontal resistance levels at $75.31 and $72.73 as well as the 20- period simple moving average (marks the inner band of the Bollinger Band’s construction).
Consequently, the combination of technical tools between $75.31 and $72.73 could be an area sellers target in this market to perhaps try for fresh lows, in line with the current downtrend.
This material on this website is intended for illustrative purposes and general information only. It does not constitute financial advice nor does it take into account your investment objectives, financial situation or particular needs. Commission, interest, platform fees, dividends, variation margin and other fees and charges may apply to financial products or services available from FP Markets. The information in this website has been prepared without taking into account your personal objectives, financial situation or needs. You should consider the information in light of your objectives, financial situation and needs before making any decision about whether to acquire or dispose of any financial product. Contracts for Difference (CFDs) are derivatives and can be risky; losses can exceed your initial payment and you must be able to meet all margin calls as soon as they are made. When trading CFDs you do not own or have any rights to the CFDs underlying assets.
FP Markets recommends that you seek independent advice from an appropriately qualified person before deciding to invest in or dispose of a derivative. A Product Disclosure Statement for each of the financial products is available from FP Markets can be obtained either from this website or on request from our offices and should be considered before entering into transactions with us. First Prudential Markets Pty Ltd (ABN 16 112 600 281, AFS Licence No. 286354).
Recommended Content
Editors’ Picks
EUR/USD retreats below 1.0700 after upbeat US employment data

EUR/USD has lost its recovery momentum and retreated slightly below 1.0700 in the early American session on Thursday. After the monthly data published by the ADP showed that private sector payrolls rose 278,000 in May, the US Dollar found support and forced the pair to edge lower.
GBP/USD rises above 1.2450 as risk flows dominate

GBP/USD is recovering above 1.2450 in the European session, as the US Dollar resumes its downside amid a risk-on market mood. Renewed dovish Fed expectations and US debt deal passage keep the US Dollar undermined ahead of the US ADP jobs and ISM Manufacturing PMI data.
Gold price rebounds toward $1,970 amid renewed US Dollar selling

Gold price is rebounding toward $1,970, having found strong bids near $1,950. The risk-on market profile is weighing on the US Dollar, enabling Gold price to attempt a recovery. The further upside, however, appears elusive amid rallying US Treasury bond yields. US data awaited.
Bitcoin likely to remain in red through the next quarter if history is any indication

Bitcoin (BTC) price produced a monthly close at $27,210, noting a -6.92% return for May. The last-minute slide in BTC put an end to the four-month bullish streak that kickstarted the 2023 rally.
C3.ai gets punched in the face, is the AI hype a bit overdone?

OMG! Stocks sold off on Wednesday….and NVDA? That stock gave back $15 or 3.8% - What is going on? That is not supposed to happen….it can only go up! Quick someone call the NVDA police!