Xpeng Stock Forecast: XPEV drops over 11% on Covid shutdowns


  • SEC announced the non-compliance and possible delisting of five Chinese stocks last week.
  • China has shut down Shanghai and Shenzen over covid infections.
  • Xpeng has joined three European auto organizations.

Xpeng stock (XPEV) has started the week by trading all the way back under its US IPO price back in August 2020. Midday on Monday shares are down more than 11% to $20.30. Nearly all Chinese equities are trading lower after Covid-19 shutdowns were announced on Sunday in Shenzen and Shanghai as well. These shutdowns are serious enough to cause production stoppages at Foxconn.

Additionally, it was reported over the weekend that Russia had asked China to aid its war against Ukraine, an action that some observers say could put Chinese firms on Western sanctions lists. Russia, however, has denied this.

Shares are also feeling the burn from the US Securities & Exchange Commission's (SEC) actions last week. The SEC announced the possible delisting of five Chinese companies that trade on US exchanges.

Xpeng has joined three Europeans automobile associations in a sign of its intent on entering the EU market on a greater scale. The European Association for Electromobility (AVERE), Royal RAI Vereniging / RAI Association (RAI) and BIL Sweden have all given Xpeng membership.

Fallout from DiDi Global (DIDI) being denied a listing in Hong Kong has also carried into Monday. DiDi's US shares dropped about 44% on Friday after the news broke.

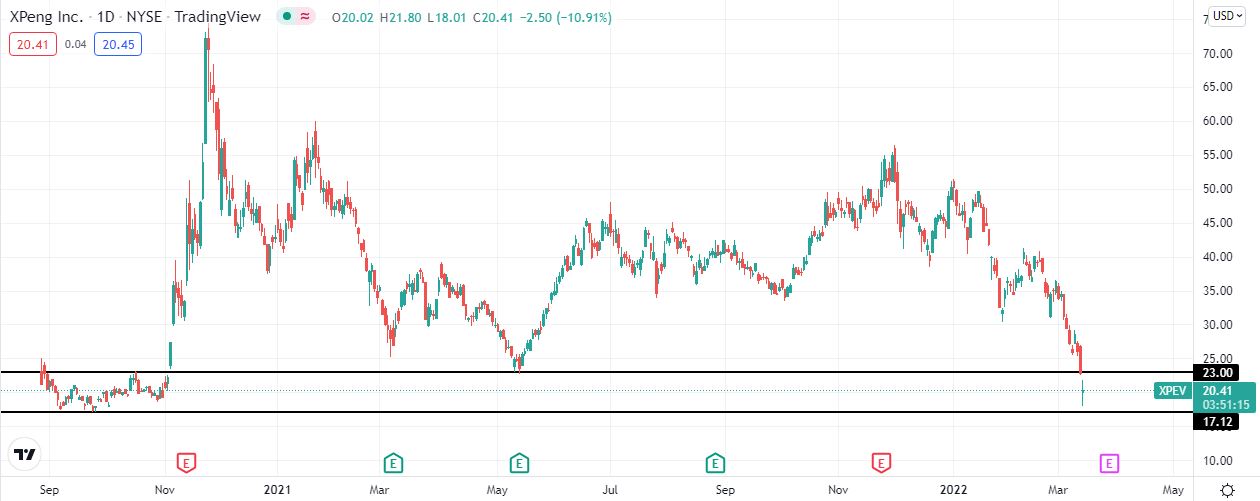
Xpeng Stock Forecast: Finding support below IPO price

Xpeng stock is now trading below its $21.10 low on it first day of trading in the US back on August 27, 2020. From here, investors better hope that XPEV share remain above $17.12. This is the only support structure left at this point and stem from September of 2020. If it does break $17.12, then XPEV shares are in no-man's land and will need to rediscover a new support level. Xpeng stock will not return to neutral until shares regain $23, a price that has served both as support and resistance over the past 18 months.

XPEV 1-day chart

Share: Feed news

Information on these pages contains forward-looking statements that involve risks and uncertainties. Markets and instruments profiled on this page are for informational purposes only and should not in any way come across as a recommendation to buy or sell in these assets. You should do your own thorough research before making any investment decisions. FXStreet does not in any way guarantee that this information is free from mistakes, errors, or material misstatements. It also does not guarantee that this information is of a timely nature. Investing in Open Markets involves a great deal of risk, including the loss of all or a portion of your investment, as well as emotional distress. All risks, losses and costs associated with investing, including total loss of principal, are your responsibility. The views and opinions expressed in this article are those of the authors and do not necessarily reflect the official policy or position of FXStreet nor its advertisers. The author will not be held responsible for information that is found at the end of links posted on this page.

If not otherwise explicitly mentioned in the body of the article, at the time of writing, the author has no position in any stock mentioned in this article and no business relationship with any company mentioned. The author has not received compensation for writing this article, other than from FXStreet.

FXStreet and the author do not provide personalized recommendations. The author makes no representations as to the accuracy, completeness, or suitability of this information. FXStreet and the author will not be liable for any errors, omissions or any losses, injuries or damages arising from this information and its display or use. Errors and omissions excepted.

The author and FXStreet are not registered investment advisors and nothing in this article is intended to be investment advice.

Recommended content


Recommended content

Editors’ Picks

EUR/USD alternates gains with losses near 1.0720 post-US PCE

EUR/USD alternates gains with losses near 1.0720 post-US PCE

The bullish tone in the Greenback motivates EUR/USD to maintain its daily range in the low 1.070s in the wake of firmer-than-estimated US inflation data measured by the PCE.

EUR/USD News

GBP/USD clings to gains just above 1.2500 on US PCE

GBP/USD clings to gains just above 1.2500 on US PCE

GBP/USD keeps its uptrend unchanged and navigates the area beyond 1.2500 the figure amidst slight gains in the US Dollar following the release of US inflation tracked by the PCE.

GBP/USD News

Gold keeps its daily gains near $2,350 following US inflation

Gold keeps its daily gains near $2,350 following US inflation

Gold prices maintain their constructive bias around $2,350 after US inflation data gauged by the PCE surpassed consensus in March and US yields trade with slight losses following recent peaks.

Gold News

Bitcoin Weekly Forecast: BTC’s next breakout could propel it to $80,000 Premium

Bitcoin Weekly Forecast: BTC’s next breakout could propel it to $80,000

Bitcoin’s recent price consolidation could be nearing its end as technical indicators and on-chain metrics suggest a potential upward breakout. However, this move would not be straightforward and could punish impatient investors. 

Read more

Week ahead – Hawkish risk as Fed and NFP on tap, Eurozone data eyed too

Week ahead – Hawkish risk as Fed and NFP on tap, Eurozone data eyed too

Fed meets on Wednesday as US inflation stays elevated. Will Friday’s jobs report bring relief or more angst for the markets? Eurozone flash GDP and CPI numbers in focus for the Euro.

Read more

Forex MAJORS

Cryptocurrencies

Signatures