- Unconfirmed US-Iran deal may unlock Iranian oil exports, pressure WTI prices.
- Saudi Arabia’s crude oil output cut of 1M bpd softens WTI’s decline.
- US Dollar weakness caps WTI’s fall as jobs report spurs rate hike uncertainty.
Western Texas Intermediate (WTI), the US crude oil benchmark, dropped sharply during Thursday’s North American session, courtesy of an “unconfirmed” report that the United States (US) and Iran may be near a temporary nuclear deal, which could unblock sanctions imposed by the US on Iran oil exports. WTI is trading at $70.38, below its opening price by 2.82%.
US crude benchmark plunges amidst rumors of potential Iran sanctions relief
According to Reuters, “Oil fell on a news report, citing sources, that Iran and the US are nearing a temporary deal that would trade some sanctions relief in exchange for reducing Iran’s uranium enrichment.”
If Iran agrees to reduce its uranium-enriched development, it could export up to a million barrels of oil daily and access frozen funds abroad.
WTI’s fall was cushioned by over-the-weekend developments with the Organization of Petroleum Exporting Countries and its allies (OPEC+) meeting on Sunday, with Saudi Arabia agreeing to cut its crude oil output by 1 million barrels per day (bpd) in July, as the cartel tries to boost oil prices.
Another factor that capped WTI’s fall was stockpiles in the US dropped last week by 451K barrels on June 2, as reported by the US Energy Information Administration (EIA). The markets expected a rise of 1M barrels per day.
Notably, the greenback posted several losses after a labor market report indicated that unemployment claims in the United States (US) rose above estimates. After the data, the consensus amongst investors that the US Federal Reserve (Fed) will skip increasing rates at the June meeting weakened the US Dollar. The US Dollar Index (DXY) is down 0.67%, at 103.347.
WTI Price Analysis: Technical outlook
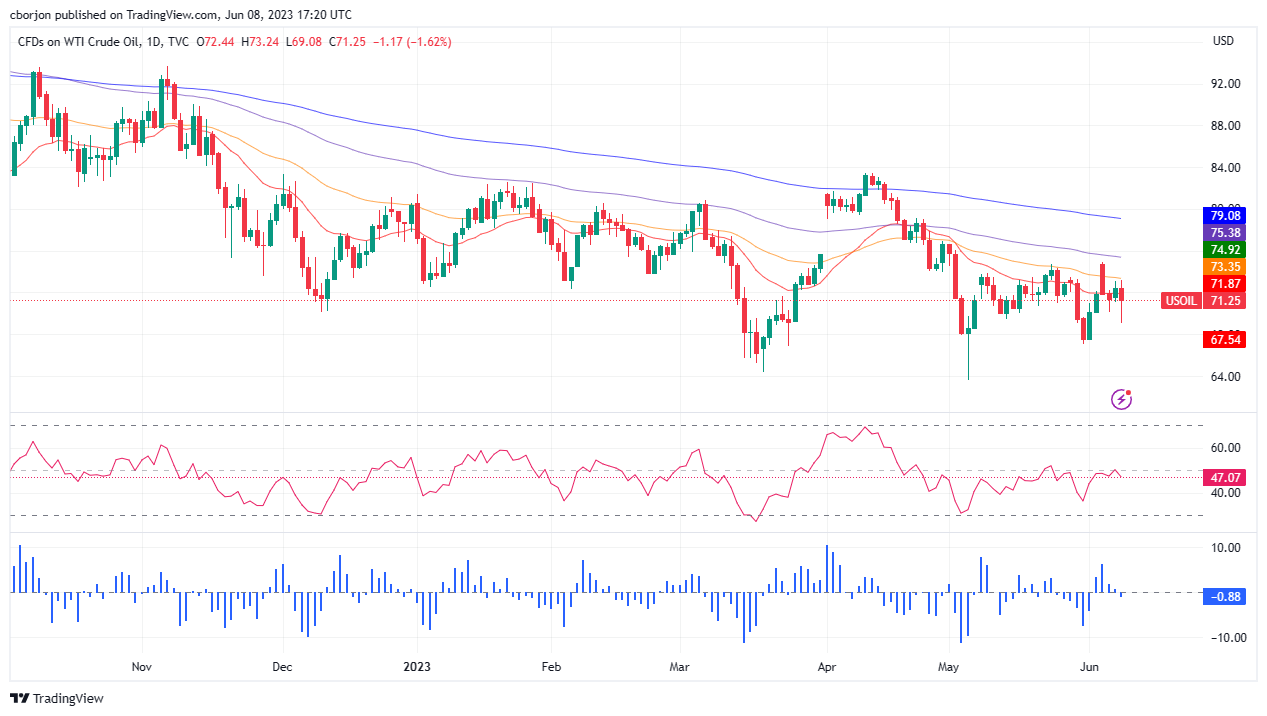
WTI remains neutral to downward bias, yet still below the 20-day Exponential Moving Average (EMA), the first resistance at $71.86. Oil will continue its downtrend past that area and can challenge 2023 year-to-date (YTD) low of $63.61 if sellers claim the May 31 low of $67.08. It should be said that oscillators justify further downside, but if WTI breaks above the 20-day EMA and clears the 50-day EMA at $73.3s5, that could pave the way for further gains.
Information on these pages contains forward-looking statements that involve risks and uncertainties. Markets and instruments profiled on this page are for informational purposes only and should not in any way come across as a recommendation to buy or sell in these assets. You should do your own thorough research before making any investment decisions. FXStreet does not in any way guarantee that this information is free from mistakes, errors, or material misstatements. It also does not guarantee that this information is of a timely nature. Investing in Open Markets involves a great deal of risk, including the loss of all or a portion of your investment, as well as emotional distress. All risks, losses and costs associated with investing, including total loss of principal, are your responsibility. The views and opinions expressed in this article are those of the authors and do not necessarily reflect the official policy or position of FXStreet nor its advertisers. The author will not be held responsible for information that is found at the end of links posted on this page.
If not otherwise explicitly mentioned in the body of the article, at the time of writing, the author has no position in any stock mentioned in this article and no business relationship with any company mentioned. The author has not received compensation for writing this article, other than from FXStreet.
FXStreet and the author do not provide personalized recommendations. The author makes no representations as to the accuracy, completeness, or suitability of this information. FXStreet and the author will not be liable for any errors, omissions or any losses, injuries or damages arising from this information and its display or use. Errors and omissions excepted.
The author and FXStreet are not registered investment advisors and nothing in this article is intended to be investment advice.
Recommended content
Editors’ Picks
EUR/USD rebounds from multi-week lows, trades above 1.0750

EUR/USD came under heavy bearish pressure and declined to its weakest level in three weeks below 1.0750 on Friday after the stronger-than-expected Nonfarm Payrolls data. Week-end flows, however, helped the pair erase its daily losses.
GBP/USD remains on track to snap three-week winning streak

GBP/USD recovered toward 1.2550 after coming in within a touching distance of 1.2500 in the second half of the day after Nonfarm Payrolls came in at 199,000 for November. Despite the recent rebound, the pair remains on track to snap a three-week winning streak.
Gold retreats below $2,020 as US yields push higher

Gold broke below its daily range and declined toward $2,010 with the immediate reaction to the upbeat US November jobs report. Although XAU/USD managed to recover toward $2,020, rising US Treasury bond yields triggered another leg lower.
Bitcoin price could retrace to $42,000 if US Nonfarm Payroll comes in at 180,000

Bitcoin price just like other assets, is highly impacted by the macro-financial developments. This includes the Nonfarm Payrolls (NFP) report released by the BLS of the United States.
The week ahead – Fed, ECB and Bank of England rate decisions

When the Federal Reserve kept rates unchanged back in November for the second meeting in a row there was still the distinct possibility that the final meeting of 2023 would provide the possibility of one more rate rise to round off the year in line with Fed policymakers dot plot forecasts of 5.6%.