WTI tests $74 as Crude Oil gets dragged higher by Middle East tensions
- Crude Oil markets bumped on continued threat of Middle East conflict spillover.
- Cargo ships are beign diverted from the Red Sea for the foreseeable future.
- Record buildup in US fuel stocks capping upside potential in Crude Oil.

West Texas Intermediate (WTI) US Crude Oil rose again on Friday, tapping 74.27 as Middle East tensions continue to weigh on energy markets.
Logistics and shipping companies continue to divert cargo ships away from the Suez Canal to avoid Houthi rebel-infested waters off the coast of Yemen, sending Europe-Aisa connecting shipping lanes around the African continent.
A US-led coalition of naval warships is struggling to secure the waterways of Yemeni shores as Iran-backed Houthi rebels continue to target civilian ships passing through the region, and the arrival of an Iranian warship has complicated matters as Iran plays chicken with coalition naval forces.
The ongoing Israel-Hamas conflict rages on, threatening to spill over into neighboring countries. While Israel and Palestine are not key players in Crude Oil markets, several nations surrounding the Gaza region are viewed as critical participants.
Iran is reportedly withholding further Crude shipments to China according to reporting by Reuters, citing unnamed sources within the oil industry.
In a bid to seek higher prices for their Crude Oil exports to China, Iran is allegedly suspending shipments to the world’s largest oil importer until China agrees to pay higher prices for Iranian barrels.
The move comes shortly after China front-loaded a significant portion of their anticipated Crude Oil demand for the year after enjoying a $10 billion discount on Crude Oil imports through the first three quarters of 2023 by specifically importing from sanction-plagued Iran. Iran, in a bid to bolster their government finances, is closing the discount gap that China sees on Iranian Crude Oil imports, leaving Chinese refiners in a tough spot where they have to choose between paying full price on the global market or accepting a reduced discount margin on Iranian barrels.
WTI Technical Outlook
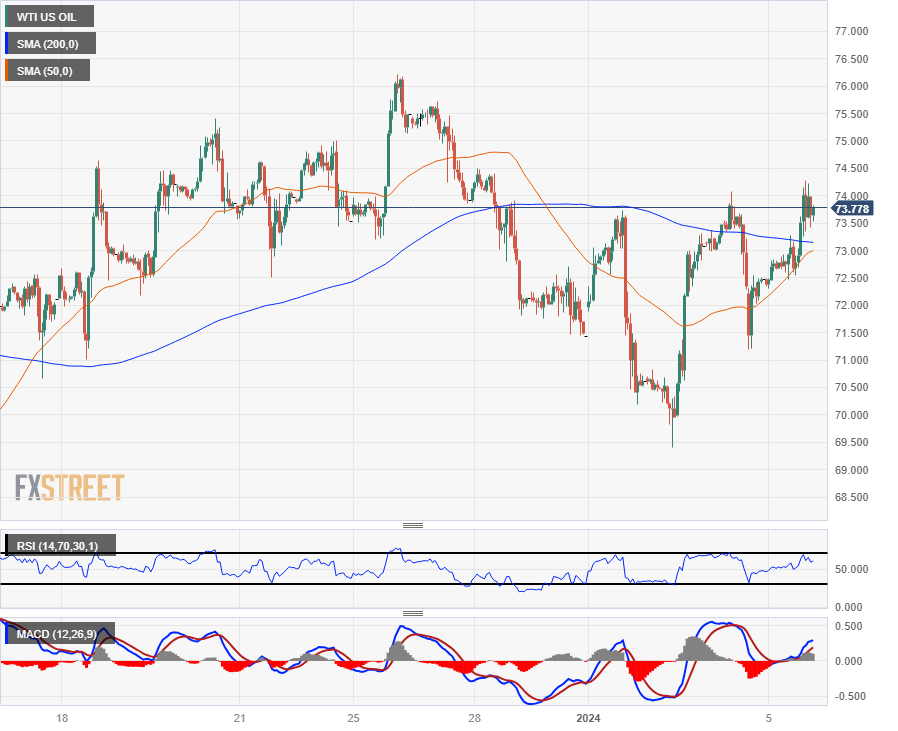
Friday’s upside drive in WTI brings US Crude Oil back over the 200-hour Simple Moving Average (SMA) to test territory north of $74.00, but technical pressures are hardening the key price handle.
US Crude Oil has climbed over 6% from the weekly low near $69.41 as WTI bidders continue to gather steam for repeated attempts at pushing into fresh highs, but so far topside momentum remains limited as clunky markets continue to grapple with the charts.
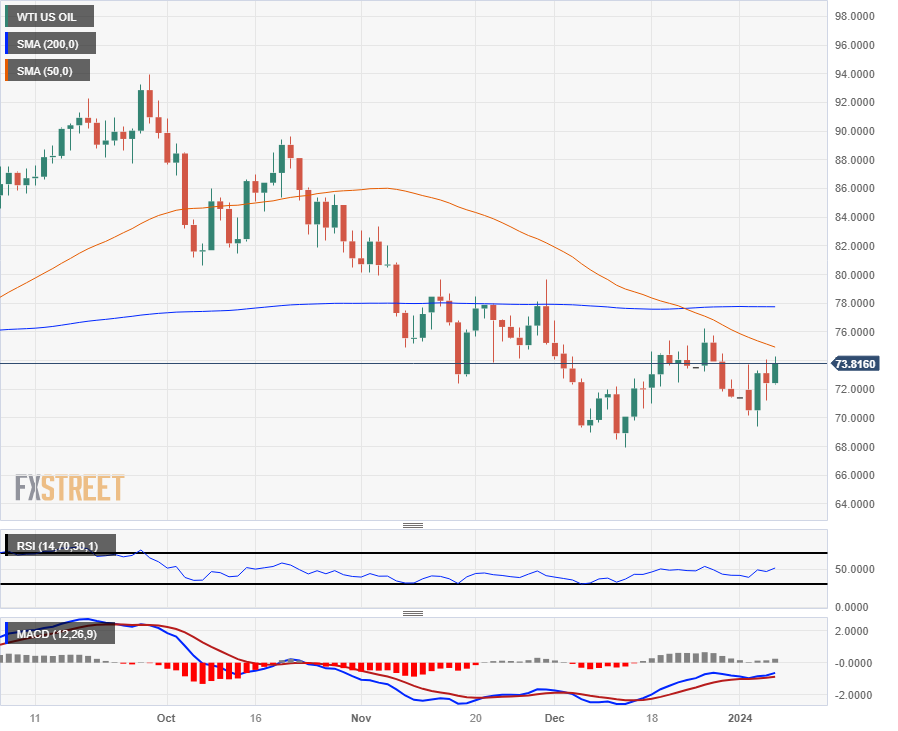
Daily candlesticks have WTI snared beneath the 200-day SMA at the $78.00 handle, capped by technical resistance from a bearish crossover of the 50-day and 200-day SMAs, and the near-term technical ceiling currently sits at the $76.00 price level at December’s swing high.
WTI Hourly Chart
WTI Daily Chart
WTI Technical Levels
Author

Joshua Gibson
FXStreet
Joshua joins the FXStreet team as an Economics and Finance double major from Vancouver Island University with twelve years' experience as an independent trader focusing on technical analysis.


