|

WTI Price Analysis: Thursday’s Doji keeps oil sellers hopeful around $63.00

  • WTI snaps four-day winning streak, trims early Asian losses off-late.
  • Bearish candlestick, overbought RSI favor WTI sellers to eye monthly support line.
  • One-week-old rising trend line adds to the upside filters.

WTI remains on the back foot, currently down 0.11% to $63.20, despite the latest bounce off intraday low of $62.71 during the early Friday.

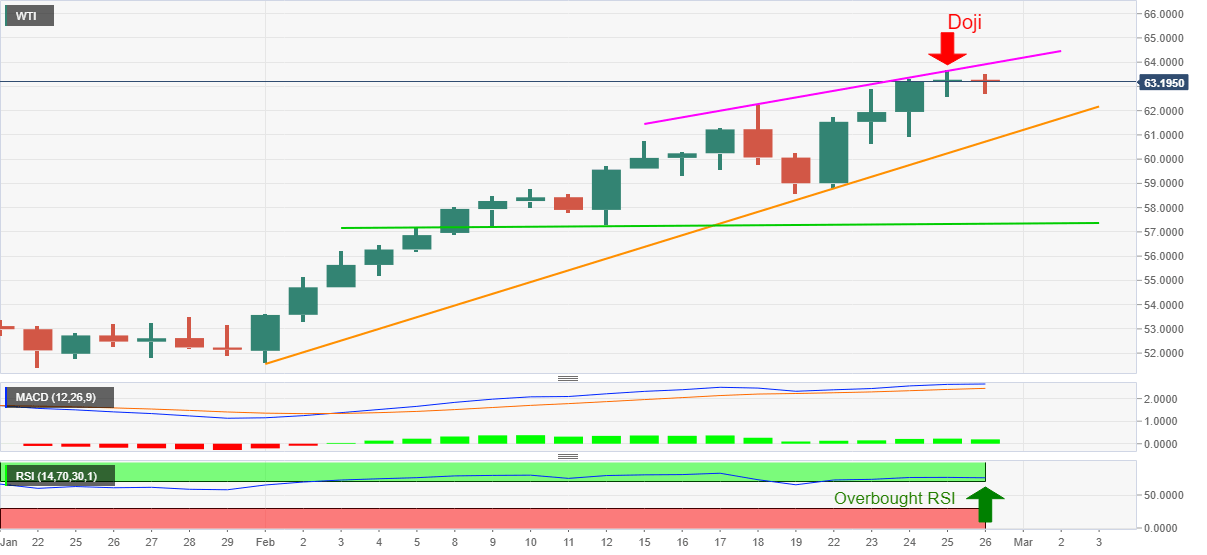
The black gold refreshed a 13-month high the previous day before declining from $63.71. The following pullback, however, couldn’t last long and portrayed a Doji candlestick on the daily (1D) chart.

Not only the bearish candlestick but overbought RSI conditions also probe the energy benchmark’s uptrend.

Hence, oil sellers can keep their eyes on the monthly support line, at $60.72 now, during further declines. However, any further weakness will be probed by the three-week-old horizontal support near $57.40.

Alternatively, a daily closing beyond $63.71 will defy the bearish Doji but will need a clear break of the immediate resistance line, currently around $64.00 to recall the oil buyers.

Overall, WTI bulls seem tiring and hence notable pullbacks can’t be ruled out.

WTI daily chart

Trend: Pullback expected

Additional important levels

Overview
Today last price63.14
Today Daily Change-0.14
Today Daily Change %-0.22%
Today daily open63.28
 
Trends
Daily SMA2058.59
Daily SMA5053.81
Daily SMA10048.05
Daily SMA20043.97
 
Levels
Previous Daily High63.72
Previous Daily Low62.59
Previous Weekly High62.25
Previous Weekly Low58.58
Previous Monthly High53.94
Previous Monthly Low47.26
Daily Fibonacci 38.2%63.29
Daily Fibonacci 61.8%63.02
Daily Pivot Point S162.67
Daily Pivot Point S262.07
Daily Pivot Point S361.55
Daily Pivot Point R163.8
Daily Pivot Point R264.32
Daily Pivot Point R364.92

Author

Anil Panchal

Anil Panchal

FXStreet

Anil Panchal has nearly 15 years of experience in tracking financial markets. With a keen interest in macroeconomics, Anil aptly tracks global news/updates and stays well-informed about the global financial moves and their implications.

More from Anil Panchal
Share:

Editor's Picks

EUR/USD remains offered below 1.1600, seems vulnerable near multi-month low

The EUR/USD pair struggles to capitalize on the overnight bounce from the 1.1530 region, or the lowest level since November 2025, and lower for the third consecutive day on Wednesday. Spot prices slide back below the 1.1600 mark during the Asian session and seem vulnerable to slide further.

GBP/USD slips below key averages as geopolitical risks mount

GBP/USD fell about 0.35% on Tuesday, settling around 1.3350 after slipping below the 200-day Exponential Moving Average for the first time since early December. The pair has pulled back sharply from its late-January high near 1.3870, shedding over 500 pips in a series of lower highs and lower lows. 

Gold rebounds ahead of US ADP, will it last?

Gold finds renewed Asian bids and retests $5,230 early Wednesday after the heavy sell-off on Tuesday. The US Dollar stands tall amid escalating Middle East tensions and reduced dovish Fed expectations. Gold defends $5,000 or 50% Fibo level after facing rejection at the 78.6% Fibo resistance at $5,342 amid bullish RSI.  

Bitcoin, Ethereum and Ripple struggle for direction as consolidation persists

Bitcoin, Ethereum and Ripple prices trade with a cautious tone at the time of writing on Wednesday as upside momentum continues to fade across the broader crypto market. BTC remains within a parallel channel, ETH struggles below key resistance, while XRP remains fragile within a descending channel. These top three cryptocurrencies by market capitalization continue to struggle to establish a directional bias amid the consolidation phase.

Energy shock 2.0: Why rising Gas prices could hit the Euro

Even without a confirmed, sustained disruption, the mere risk to a key global energy chokepoint is enough to inject a significant premium into European Gas markets. And for the Euro, that matters.

Ripple falters amid sell-off jitters and negative funding rates

Ripple (XRP) has come under pressure, drifting lower to $1.35 at the time of writing on Tuesday. The over 2% correction looks poised to erase the previous day’s gains, which lifted the remittance token to $1.42.