WTI Price Analysis: Teasing head-and-shoulders breakdown on 1H chart


  • WTI consolidates the downside before the next leg lower.
  • US oil charts a potential head-and-shoulders pattern on hourly chart.
  • Trades below all major HMAs, with bearish RSI.

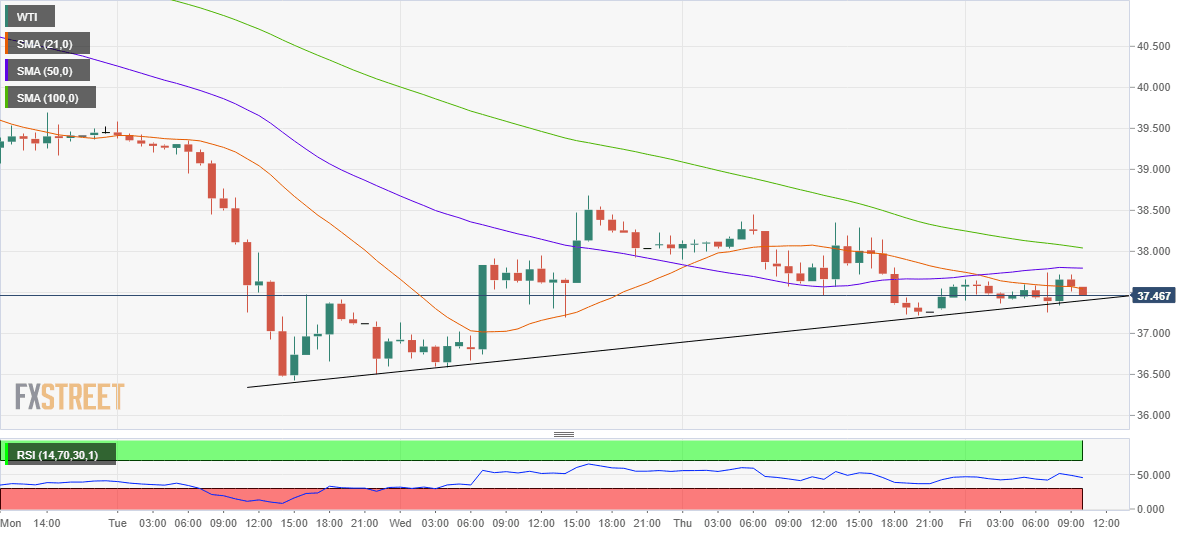
The choppy trading in WTI (futures on Nymex) over the few days has carved out a head-and-shoulders pattern on the hourly sticks.

The price is on the verge of a pattern breakdown, as it flirts with a neckline at 37.39. A sustained closing below the latter will open floors for a test of the pattern target at 35.50.

On its way to the pattern target, the bears could challenge multi-month lows at 36.42.

Alternatively, any bounce will confront the horizontal 50-hourly Simple Moving Average (HMA) at 37.80.

Acceptance above the latter could add legs to the corrective bounce towards the 100-HMA at 38.05.

The hourly Relative Strength Index (RSI) remains in the bearish territory, pointing south at 45.15, indicative of the further declines.

WTI: Hourly chart

fxsoriginal

WTI: Additional levels

WTI

Overview
Today last price 37.54
Today Daily Change 0.31
Today Daily Change % 0.83
Today daily open 37.26
 
Trends
Daily SMA20 41.65
Daily SMA50 41.39
Daily SMA100 36.95
Daily SMA200 41.48
 
Levels
Previous Daily High 38.45
Previous Daily Low 37.22
Previous Weekly High 43.7
Previous Weekly Low 39.61
Previous Monthly High 43.86
Previous Monthly Low 39.75
Daily Fibonacci 38.2% 37.69
Daily Fibonacci 61.8% 37.98
Daily Pivot Point S1 36.84
Daily Pivot Point S2 36.41
Daily Pivot Point S3 35.61
Daily Pivot Point R1 38.07
Daily Pivot Point R2 38.87
Daily Pivot Point R3 39.3


Share: Feed news

Information on these pages contains forward-looking statements that involve risks and uncertainties. Markets and instruments profiled on this page are for informational purposes only and should not in any way come across as a recommendation to buy or sell in these assets. You should do your own thorough research before making any investment decisions. FXStreet does not in any way guarantee that this information is free from mistakes, errors, or material misstatements. It also does not guarantee that this information is of a timely nature. Investing in Open Markets involves a great deal of risk, including the loss of all or a portion of your investment, as well as emotional distress. All risks, losses and costs associated with investing, including total loss of principal, are your responsibility. The views and opinions expressed in this article are those of the authors and do not necessarily reflect the official policy or position of FXStreet nor its advertisers. The author will not be held responsible for information that is found at the end of links posted on this page.

If not otherwise explicitly mentioned in the body of the article, at the time of writing, the author has no position in any stock mentioned in this article and no business relationship with any company mentioned. The author has not received compensation for writing this article, other than from FXStreet.

FXStreet and the author do not provide personalized recommendations. The author makes no representations as to the accuracy, completeness, or suitability of this information. FXStreet and the author will not be liable for any errors, omissions or any losses, injuries or damages arising from this information and its display or use. Errors and omissions excepted.

The author and FXStreet are not registered investment advisors and nothing in this article is intended to be investment advice.

Recommended content


Recommended content

Editors’ Picks

USD/JPY holds above 155.50 ahead of BoJ policy announcement

USD/JPY holds above 155.50 ahead of BoJ policy announcement

USD/JPY is trading tightly above 155.50, off multi-year highs ahead of the BoJ policy announcement. The Yen draws support from higher Japanese bond yields even as the Tokyo CPI inflation cooled more than expected. 

USD/JPY News

AUD/USD consolidates gains above 0.6500 after Australian PPI data

AUD/USD consolidates gains above 0.6500 after Australian PPI data

AUD/USD is consolidating gains above 0.6500 in Asian trading on Friday. The pair capitalizes on an annual increase in Australian PPI data. Meanwhile, a softer US Dollar and improving market mood also underpin the Aussie ahead of the US PCE inflation data. 

AUD/USD News

Gold price keeps its range around $2,330, awaits US PCE data

Gold price keeps its range around $2,330, awaits US PCE data

Gold price is consolidating Thursday's rebound early Friday. Gold price jumped after US GDP figures for the first quarter of 2024 missed estimates, increasing speculation that the Fed could lower borrowing costs. Focus shifts to US PCE inflation on Friday. 

Gold News

Stripe looks to bring back crypto payments as stablecoin market cap hits all-time high

Stripe looks to bring back crypto payments as stablecoin market cap hits all-time high

Stripe announced on Thursday that it would add support for USDC stablecoin, as the stablecoin market exploded in March, according to reports by Cryptocompare.

Read more

US economy: Slower growth with stronger inflation

US economy: Slower growth with stronger inflation

The US Dollar strengthened, and stocks fell after statistical data from the US. The focus was on the preliminary estimate of GDP for the first quarter. Annualised quarterly growth came in at just 1.6%, down from the 2.5% and 3.4% previously forecast.

Read more

Forex MAJORS

Cryptocurrencies

Signatures