WTI Price Analysis: Sellers need $76.40 breakdown to keep reins
- WTI extends pullback from multi-month top, refreshes intraday low.
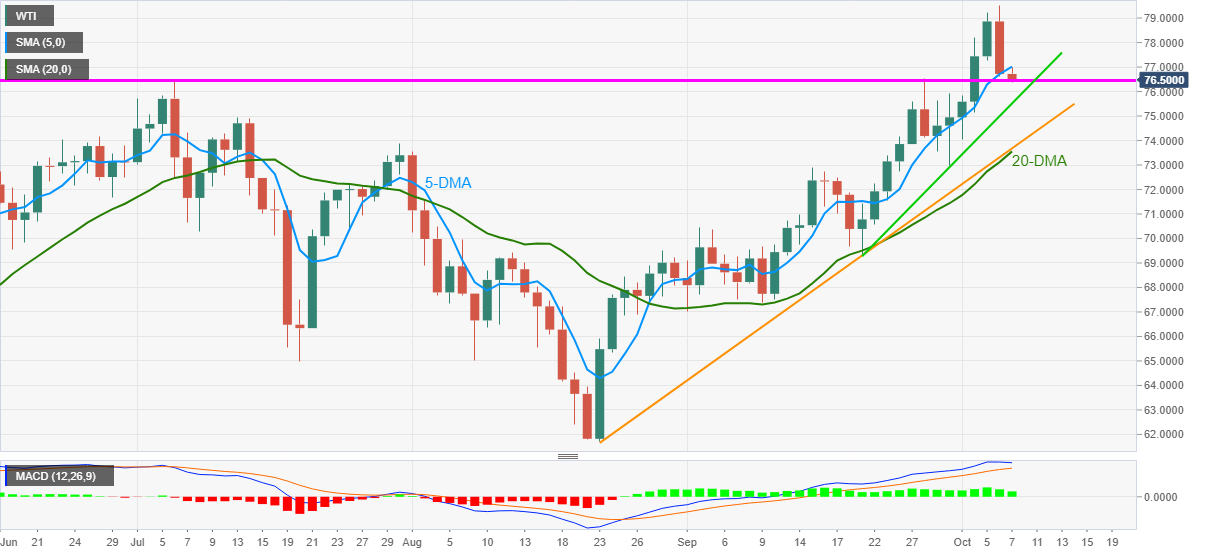
- Three-month-old horizontal area restricts immediate downside.
- 5-DMA, receding bullish bias of MACD hint at further weakness.

WTI remains on the back foot, keeping the previous day’s losses, while poking intraday low of $76.37, down 0.26% on a day during early Thursday.
The black gold jumped to the fresh high since November 2014 before taking a U-turn from $79.53 and mark the heaviest daily loss in seven weeks the previous day.
The latest weakness takes clues from the quote’s downside break of 5-DMA as well as the softer MACD line from the overbought limit.
However, tops marked since July, around $76.50-40 challenge the bears before directing them to a 12-day-old support line near $75.50.
Following that, a convergence of 20-DMA and an ascending trend line from August 23, around $73.55, will be a tough nut to crack for WTI sellers.
Meanwhile, recovery moves need to cross the 5-DMA hurdle, close to $77.00 before eying the latest peak surrounding $79.55 and the $80.00 psychological magnet.
Overall, WTI crude oil is long due for a pullback but has strong supports before allowing the bears to take the fort.
WTI: Daily chart
Trend: Pullback expected
Author

Anil Panchal
FXStreet
Anil Panchal has nearly 15 years of experience in tracking financial markets. With a keen interest in macroeconomics, Anil aptly tracks global news/updates and stays well-informed about the global financial moves and their implications.


