WTI Price Analysis: Retreats from four-month-old resistance to sub-$89.00 region


  • WTI crude oil eases from three-week high, snaps two-day uptrend.
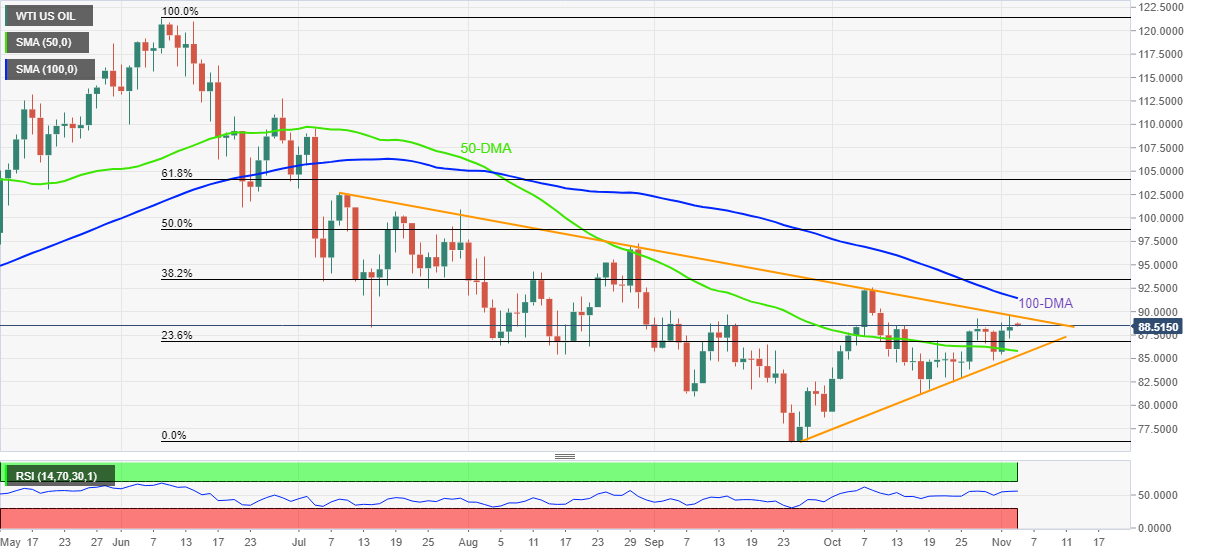
  • Firmer RSI and successful trading above 50-DMA favor buyers.
  • 100-DMA adds to the upside filters, bears need validation from $85.30 to retake control.

WTI crude oil pares recent losses around $88.50 while posting the first intraday loss in three during Thursday’s Asian session.

The black gold rose to the highest level since October 12 during the previous day before reversing from a four-month-old descending resistance line. The pullback move, however, remains beyond the 50-DMA and keeps the buyers hopeful. Also challenging the bearish bias is the steadily rising RSI (14), not overbought.

That said, the quote’s latest pullback remains elusive unless breaking the 50-DMA support of $85.80. Also acting as the short-term key support is an upward-sloping trend line from September 27, near $85.30.

In a case where the energy benchmark drops below $85.30, $81.30 and an early September low of $80.95 can please the WTI bears before directing them to the $80.00 and September’s monthly bottom of $76.08.

Meanwhile, the aforementioned resistance line from early July, close to $89.50 at the latest, guards the quote’s immediate run-up ahead of the 100-DMA hurdle surrounding $91.45.

Following that, the tops marked during October and late August, near $92.65 and $97.30 in that order, could lure the WTI crude oil buyers.

WTI: Daily chart

Trend: Limited downside expected

Additional important levels

Overview
Today last price 88.56
Today Daily Change 0.58
Today Daily Change % 0.66%
Today daily open 87.98
 
Trends
Daily SMA20 86.65
Daily SMA50 86.03
Daily SMA100 91.95
Daily SMA200 97.39
 
Levels
Previous Daily High 88.85
Previous Daily Low 85.38
Previous Weekly High 89.3
Previous Weekly Low 82.4
Previous Monthly High 92.63
Previous Monthly Low 79.32
Daily Fibonacci 38.2% 87.52
Daily Fibonacci 61.8% 86.7
Daily Pivot Point S1 85.96
Daily Pivot Point S2 83.93
Daily Pivot Point S3 82.49
Daily Pivot Point R1 89.42
Daily Pivot Point R2 90.87
Daily Pivot Point R3 92.89


Share: Feed news

Information on these pages contains forward-looking statements that involve risks and uncertainties. Markets and instruments profiled on this page are for informational purposes only and should not in any way come across as a recommendation to buy or sell in these assets. You should do your own thorough research before making any investment decisions. FXStreet does not in any way guarantee that this information is free from mistakes, errors, or material misstatements. It also does not guarantee that this information is of a timely nature. Investing in Open Markets involves a great deal of risk, including the loss of all or a portion of your investment, as well as emotional distress. All risks, losses and costs associated with investing, including total loss of principal, are your responsibility. The views and opinions expressed in this article are those of the authors and do not necessarily reflect the official policy or position of FXStreet nor its advertisers. The author will not be held responsible for information that is found at the end of links posted on this page.

If not otherwise explicitly mentioned in the body of the article, at the time of writing, the author has no position in any stock mentioned in this article and no business relationship with any company mentioned. The author has not received compensation for writing this article, other than from FXStreet.

FXStreet and the author do not provide personalized recommendations. The author makes no representations as to the accuracy, completeness, or suitability of this information. FXStreet and the author will not be liable for any errors, omissions or any losses, injuries or damages arising from this information and its display or use. Errors and omissions excepted.

The author and FXStreet are not registered investment advisors and nothing in this article is intended to be investment advice.

Recommended content


Recommended content

Editors’ Picks

AUD/USD gains momentum above 0.6500 ahead of Australian Retail Sales data

AUD/USD gains momentum above 0.6500 ahead of Australian Retail Sales data

AUD/USD trades in positive territory for six consecutive days around 0.6535 during the early Asian session on Monday. The upward momentum of the pair is bolstered by the hawkish stance from the Reserve Bank of Australia after the recent release of Consumer Price Index inflation data last week.

AUD/USD News

EUR/USD: Federal Reserve and Nonfarm Payrolls spell action this week

EUR/USD: Federal Reserve and Nonfarm Payrolls spell action this week

The EUR/USD pair temporarily reconquered the 1.0700 threshold last week, settling at around that round level. The US Dollar lost its appeal following discouraging United States macroeconomic data indicating tepid growth and persistent inflationary pressures.

EUR/USD News

Gold: Strength of $2,300 support is an encouraging sign for bulls

Gold: Strength of $2,300 support is an encouraging sign for bulls

Gold price started last week under heavy bearish pressure and registered its largest one-day loss of the year on Monday. The pair managed to stage a rebound in the second half of the week but closed in negative territory. 

Gold News

Ethereum fees drops to lowest level since October, ETH sustains above $3,200

Ethereum fees drops to lowest level since October, ETH sustains above $3,200

Ethereum’s high transaction fees has been a sticky issue for the blockchain in the past. This led to Layer 2 chains and scaling solutions developing alternatives for users looking to transact at a lower cost. 

Read more

Week ahead – Hawkish risk as Fed and NFP on tap, Eurozone data eyed too

Week ahead – Hawkish risk as Fed and NFP on tap, Eurozone data eyed too

Fed meets on Wednesday as US inflation stays elevated. Will Friday’s jobs report bring relief or more angst for the markets? Eurozone flash GDP and CPI numbers in focus for the Euro.

Read more

Forex MAJORS

Cryptocurrencies

Signatures