WTI Price Analysis: Overbought RSI tests bulls around $66.00


  • WTI snaps two-day winning streak while easing from $66.12.
  • Bullish chart pattern, sustained trading beyond immediate SMA support keeps buyers hopeful.
  • A daily closing beyond $66.00 becomes necessary before probing the channel resistance.

WTI bulls catch a breather around $66.00, currently down 0.22% intraday near $65.90, amid Friday’s Asian session. In doing so, the energy benchmark drops for the first time in three days while teasing the multi-month tops marked earlier in the week.

Given the overbought RSI and the market’s cautious mood ahead of US President Joe Biden’s speech, at 01:00 AM GMT, the black-gold is likely to consolidate the recent gains.

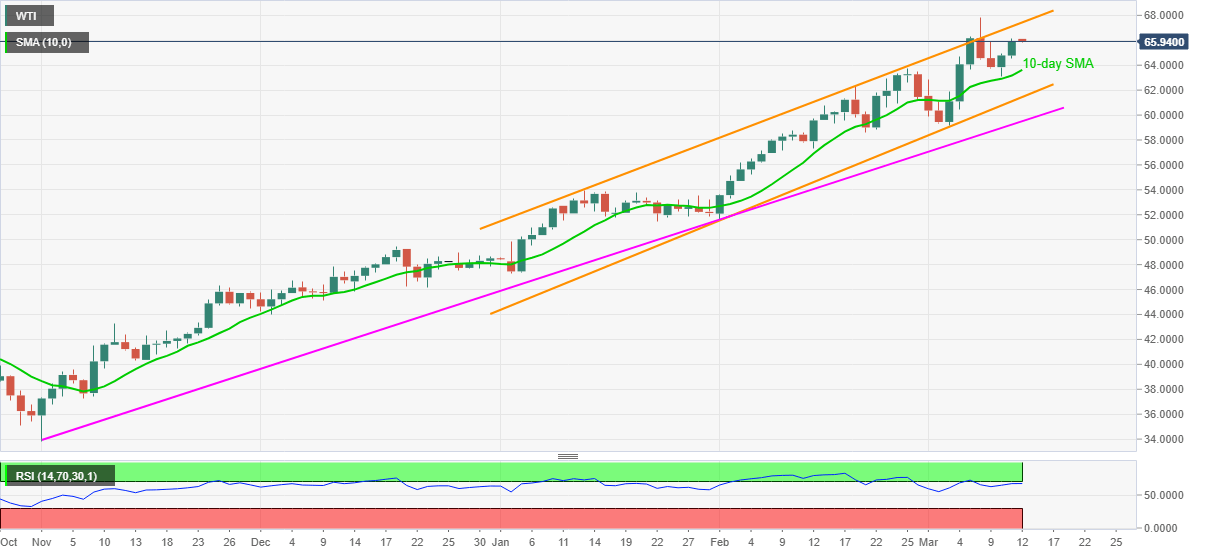
However, 10-day SMA near $63.60 can test short-term bulls ahead of directing them to the support line of a two-month-old ascending trend channel, at $61.45 now.

It should be noted that the oil’s declines past-$61.45, which defies the bullish chart formation, needs validation from an upward sloping support line from February 01, currently around $59.50.

Meanwhile, the $66.00 theshold offers an immediate upside hurdle to the WTI buyers ahead of directing them to the stated channel’s resistance line near $67.50 and the latest high of $67.86.

It’s worth mentioning that there are multiple barriers around $68.00, marked during late 2018, that could keep the WTI buyers in check ahead of directing them to the $70.00 round-figure.

WTI daily chart

Trend: Pullback expected

Additional important levels

Overview
Today last price 65.89
Today Daily Change -0.22
Today Daily Change % -0.33%
Today daily open 66.11
 
Trends
Daily SMA20 61.69
Daily SMA50 56.47
Daily SMA100 50.04
Daily SMA200 45.23
 
Levels
Previous Daily High 66.18
Previous Daily Low 64.5
Previous Weekly High 66.27
Previous Weekly Low 59.17
Previous Monthly High 63.72
Previous Monthly Low 51.6
Daily Fibonacci 38.2% 64.22
Daily Fibonacci 61.8% 63.8
Daily Pivot Point S1 63.63
Daily Pivot Point S2 62.47
Daily Pivot Point S3 61.82
Daily Pivot Point R1 65.43
Daily Pivot Point R2 66.07
Daily Pivot Point R3 67.23


Share: Feed news

Information on these pages contains forward-looking statements that involve risks and uncertainties. Markets and instruments profiled on this page are for informational purposes only and should not in any way come across as a recommendation to buy or sell in these assets. You should do your own thorough research before making any investment decisions. FXStreet does not in any way guarantee that this information is free from mistakes, errors, or material misstatements. It also does not guarantee that this information is of a timely nature. Investing in Open Markets involves a great deal of risk, including the loss of all or a portion of your investment, as well as emotional distress. All risks, losses and costs associated with investing, including total loss of principal, are your responsibility. The views and opinions expressed in this article are those of the authors and do not necessarily reflect the official policy or position of FXStreet nor its advertisers. The author will not be held responsible for information that is found at the end of links posted on this page.

If not otherwise explicitly mentioned in the body of the article, at the time of writing, the author has no position in any stock mentioned in this article and no business relationship with any company mentioned. The author has not received compensation for writing this article, other than from FXStreet.

FXStreet and the author do not provide personalized recommendations. The author makes no representations as to the accuracy, completeness, or suitability of this information. FXStreet and the author will not be liable for any errors, omissions or any losses, injuries or damages arising from this information and its display or use. Errors and omissions excepted.

The author and FXStreet are not registered investment advisors and nothing in this article is intended to be investment advice.

Recommended content


Recommended content

Editors’ Picks

EUR/USD drops to near 1.0850, further support at nine-day EMA

EUR/USD drops to near 1.0850, further support at nine-day EMA

EUR/USD continues to lose ground, trading around 1.0860 during the Asian hours on Friday. From a technical perspective on a daily chart analysis indicates a sideways trend for the pair as it continues to lie within the symmetrical triangle.

EUR/USD News

GBP/USD posts modest gains above 1.2650, focus on the Fedspeak

GBP/USD posts modest gains above 1.2650, focus on the Fedspeak

The GBP/USD pair posts modest gains near 1.2670 during the Asian session on Friday. Meanwhile, the USD Index recovers some lost ground after retracing to multi-week lows near 104.00 in the previous session.

GBP/USD News

Gold price gains ground, with Fed speakers in focus

Gold price gains ground, with Fed speakers in focus

The Gold price trades with a positive bias on Friday. The bullish move of precious metals in the previous sessions was bolstered by the softer-than-expected US inflation data in April, which triggered hope for rate cuts from the US Fed. 

Gold News

LINK price jumps 10% as Chainlink races toward tokenization of funds

LINK price jumps 10% as Chainlink races toward tokenization of funds

Chainlink price has remained range-bound for a while, stuck between the $16.00 roadblock to the upside and $13.08 to the downside. However, in light of recent revelations, the token may have further upside potential.

Read more

Fed speak tempers rate cut expectations

Fed speak tempers rate cut expectations

The biggest takeaway into Friday is the latest round of Fed speak. These Fed officials reiterated their stance rates should be kept restrictive for a longer period of time until there is more clear evidence inflation is heading back towards the 2% target.  

Read more

Forex MAJORS

Cryptocurrencies

Signatures