WTI Price Analysis: Oil bulls take a breather below $74.60 resistance confluence


  • WTI crude oil remains sidelined inside a short-term bullish channel after reversing from the highest levels in a fortnight.
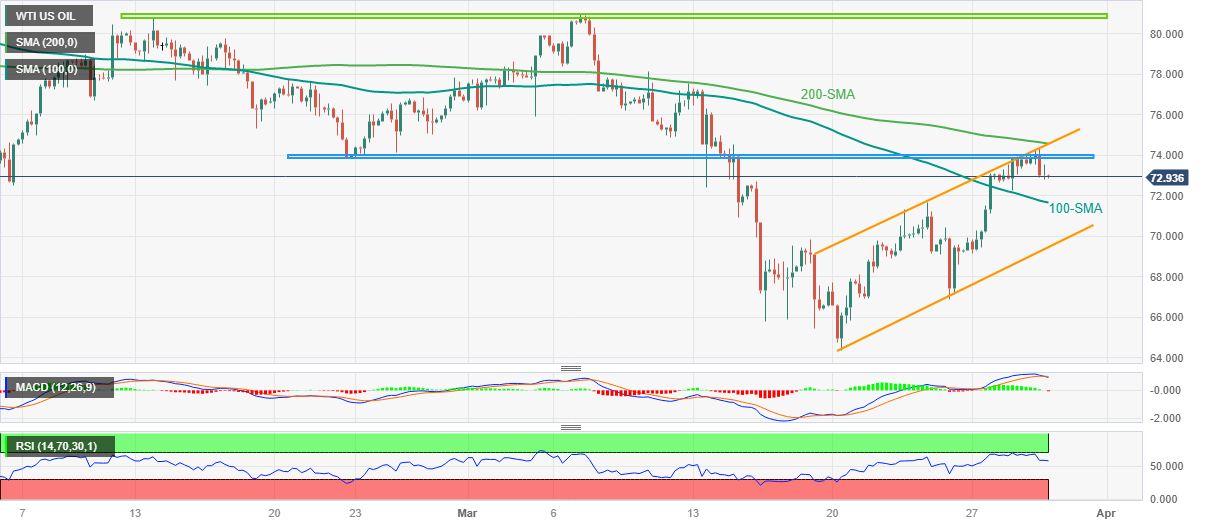
  • Five-week-old horizontal hurdle guards immediate upside, convergence of 200-SMA, channel’s top line is the key hurdle.
  • 100-SMA lures intraday sellers of Oil but further downside needs validation from $69.45.

WTI crude oil seesaws around $73.00 during Thursday’s sluggish Asian session, following its pullback from a 12-day high. In doing so, the black gold remains with the fortnight-old ascending trend channel while retreating from the channel’s top line and a five-week-long horizontal hurdle of late.

It should be noted that the energy benchmark’s latest pullback takes clues from the impending bear cross on the MACD and a retreat in the RSI (14) line after it touched the overbought territory.

With this, the commodity price is likely to decline further towards the immediate support of 100-SMA, around $71.70 by the press time.

In a case where the quote remains bearish past $71.70, the $70.00 and bottom line of the stated channel, close to $69.45, become crucial to watch as they hold the gate for the Oil bear’s entry.

Meanwhile, the aforementioned five-week-old horizontal resistance near $73.90-74.00 restricts the immediate upside of the WTI crude oil.

Following that, a convergence of the stated channel’s top line and the 200-SMA together highlights $74.60 as a tough nut to crack for Oil buyers.

Should the commodity price rally beyond $74.60, the odds of witnessing a run-up toward $77.50 and then to the $78.00 hurdles can’t be ruled out. Though, multiple hurdles marked since February 13 highlight the $80.80-81.00 as crucial resistance to watch afterward.

WTI: Four-hour chart

Trend: Pullback expected

Additional important levels

Overview
Today last price 72.93
Today Daily Change -0.69
Today Daily Change % -0.94%
Today daily open 73.62
 
Trends
Daily SMA20 73.26
Daily SMA50 76.15
Daily SMA100 77.3
Daily SMA200 84.09
 
Levels
Previous Daily High 73.97
Previous Daily Low 72.26
Previous Weekly High 71.69
Previous Weekly Low 64.39
Previous Monthly High 80.75
Previous Monthly Low 72.5
Daily Fibonacci 38.2% 73.31
Daily Fibonacci 61.8% 72.91
Daily Pivot Point S1 72.6
Daily Pivot Point S2 71.57
Daily Pivot Point S3 70.89
Daily Pivot Point R1 74.31
Daily Pivot Point R2 74.99
Daily Pivot Point R3 76.02


Share: Feed news

Information on these pages contains forward-looking statements that involve risks and uncertainties. Markets and instruments profiled on this page are for informational purposes only and should not in any way come across as a recommendation to buy or sell in these assets. You should do your own thorough research before making any investment decisions. FXStreet does not in any way guarantee that this information is free from mistakes, errors, or material misstatements. It also does not guarantee that this information is of a timely nature. Investing in Open Markets involves a great deal of risk, including the loss of all or a portion of your investment, as well as emotional distress. All risks, losses and costs associated with investing, including total loss of principal, are your responsibility. The views and opinions expressed in this article are those of the authors and do not necessarily reflect the official policy or position of FXStreet nor its advertisers. The author will not be held responsible for information that is found at the end of links posted on this page.

If not otherwise explicitly mentioned in the body of the article, at the time of writing, the author has no position in any stock mentioned in this article and no business relationship with any company mentioned. The author has not received compensation for writing this article, other than from FXStreet.

FXStreet and the author do not provide personalized recommendations. The author makes no representations as to the accuracy, completeness, or suitability of this information. FXStreet and the author will not be liable for any errors, omissions or any losses, injuries or damages arising from this information and its display or use. Errors and omissions excepted.

The author and FXStreet are not registered investment advisors and nothing in this article is intended to be investment advice.

Recommended content


Recommended content

Editors’ Picks

EUR/USD clings to gains above 1.0750 after US data

EUR/USD clings to gains above 1.0750 after US data

EUR/USD manages to hold in positive territory above 1.0750 despite retreating from the fresh multi-week high it set above 1.0800 earlier in the day. The US Dollar struggles to find demand following the weaker-than-expected NFP data.

EUR/USD News

GBP/USD declines below 1.2550 following NFP-inspired upsurge

GBP/USD declines below 1.2550 following NFP-inspired upsurge

GBP/USD struggles to preserve its bullish momentum and trades below 1.2550 in the American session. Earlier in the day, the disappointing April jobs report from the US triggered a USD selloff and allowed the pair to reach multi-week highs above 1.2600.

GBP/USD News

Gold struggles to hold above $2,300 despite falling US yields

Gold struggles to hold above $2,300 despite falling US yields

Gold stays on the back foot below $2,300 in the American session on Friday. The benchmark 10-year US Treasury bond yield stays in negative territory below 4.6% after weak US data but the improving risk mood doesn't allow XAU/USD to gain traction.

Gold News

Bitcoin Weekly Forecast: Should you buy BTC here? Premium

Bitcoin Weekly Forecast: Should you buy BTC here?

Bitcoin (BTC) price shows signs of a potential reversal but lacks confirmation, which has divided the investor community into two – those who are buying the dips and those who are expecting a further correction.

Read more

Week ahead – BoE and RBA decisions headline a calm week

Week ahead – BoE and RBA decisions headline a calm week

Bank of England meets on Thursday, unlikely to signal rate cuts. Reserve Bank of Australia could maintain a higher-for-longer stance. Elsewhere, Bank of Japan releases summary of opinions.

Read more

Forex MAJORS

Cryptocurrencies

Signatures