|

WTI Price Analysis: Off monthly low towards $64.00

  • WTI snaps two-day downtrend, picks up bids to intraday top of late.
  • Sustained trading beyond three-month-old support line, 50-day SMA favor buyers.
  • Multiple hurdles to north, bearish MACD probe odds favoring fresh high above $67.00.

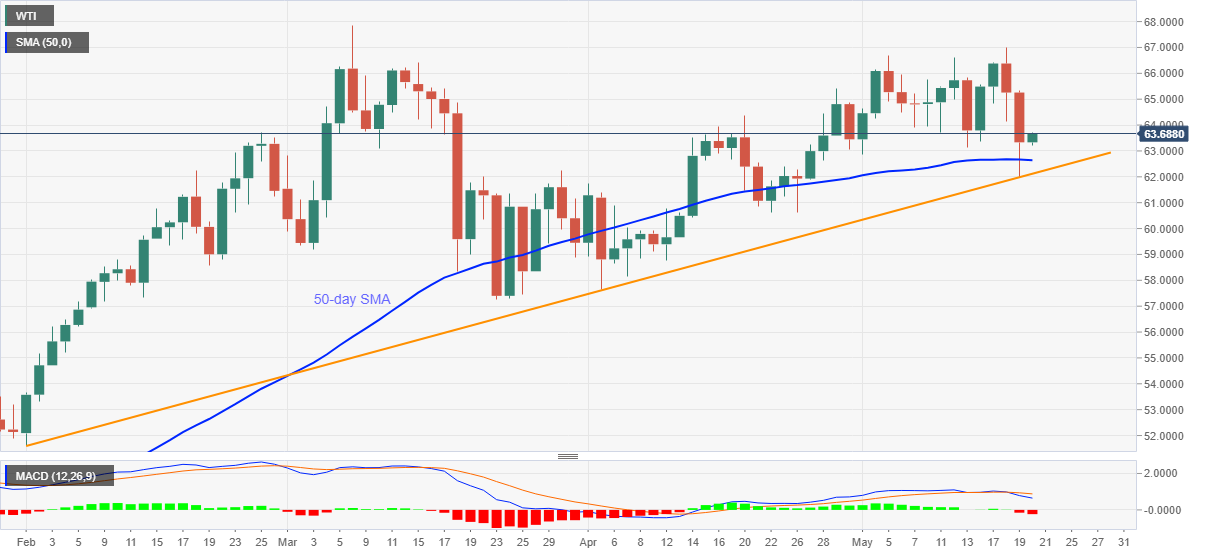
WTI takes the bids near $63.70, up 0.54% intraday, as European traders prepare for Wednesday’s bell. The oil benchmarks dropped to the lowest since April 27 the previous day before bouncing off $61.95. In doing so, the black gold stays above an ascending trend line from early February as well as 50-day SMA.

Hence, WTI is likely to keep its upside traction towards the recent top near $67.00, with $64.00 acting as immediate resistance.

It should, however, be noted that there are multiple stops between $64.00 and $67.00, especially around $66.00, that could test the bullish momentum.

Meanwhile, a 50-day SMA level of $62.60 and the stated support line near $62.10, followed by the $62.00 round-figure, restrict the WTI seller’s entry.

If at all the oil sellers dominate past $62.00, the $60.00 psychological magnet can offer an intermediate halt before directing the quote towards March lows near $57.30.

WTI daily chart.
Trend: Bullish

additional important levels

Overview
Today last price63.69
Today Daily Change0.36
Today Daily Change %0.57%
Today daily open63.33
 
Trends
Daily SMA2064.31
Daily SMA5062.66
Daily SMA10059.4
Daily SMA20050.75
 
Levels
Previous Daily High65.33
Previous Daily Low61.96
Previous Weekly High66.63
Previous Weekly Low63.12
Previous Monthly High65.4
Previous Monthly Low57.66
Daily Fibonacci 38.2%63.25
Daily Fibonacci 61.8%64.04
Daily Pivot Point S161.75
Daily Pivot Point S260.17
Daily Pivot Point S358.37
Daily Pivot Point R165.13
Daily Pivot Point R266.92
Daily Pivot Point R368.5

Author

Anil Panchal

Anil Panchal

FXStreet

Anil Panchal has nearly 15 years of experience in tracking financial markets. With a keen interest in macroeconomics, Anil aptly tracks global news/updates and stays well-informed about the global financial moves and their implications.


More from Anil Panchal
Share:

Editor's Picks

AUD/USD sits at two-month lows near 0.6950 after Australian CPI data

AUD/USD is sitting at two-month lows near 0.6950 in the Asian session on Wednesday, as below-expectations August Australian underlying CPI data pours cold water on expectations for further RBA interest rate hikes. Chinese PMI data also fail to inspire the Australian Dollar, despite a pause in the US Dollar advance.

USD/JPY stays weak below 157.00 amid Japanese intervention risks

USD/JPY keeps losses below 157.00 in the Asian session on Wednesday, as hawkish BoJ expectations, along with intervention risks, underpin the Japanese Yen, countering dismal domestic factory output and retail sales data. Meanwhile, a broad US Dollar retreat also collaborates to the pair's downside.

Gold flat lines below $4,200, as focus shifts to US ADP and PCE

Gold extends its consolidative price move in the European session, trading near the $4,200 mark. Falling US bond yields drag the US Dollar away from the two-month high, touched on Tuesday, and act as a tailwind for the commodity. However, hawkish US Federal Reserve expectations cap the upside as traders await important US macro data before placing fresh directional bets on the non-yielding bullion.

Bitcoin consolidates below $85,000 amid rising US Treasury yields, derivatives deleveraging

Bitcoin consolidates near $83,000 at the time of writing on Wednesday after bulls failed to close above the key $85,000 level earlier this week. The Crypto King's investors remain cautious amid rising US Treasury yields and several key macroeconomic data releases due this week.

US core PCE inflation set to rise in August, pressuring the Federal Reserve

The United States Bureau of Economic Analysis will publish the Personal Consumption Expenditures Price Index data for August on Wednesday at 12:30 GMT. Market participants closely watch the PCE Price Index because it is the Federal Reserve’s preferred measure of inflation and could influence its policy outlook.

Silver is more volatile than Gold ahead of PCE and NFP. This chart shows the positioning gap
The market’s attention is focused on American data this week, but there’s something only those with a trained eye may be looking at: Gold and Silver positioning gap. Financial markets are moving on fears, mostly related to persistently high energy prices driven by the Middle East war. Sure, the US Dollar (USD) is strong, but at what cost?















