|

WTI Price Analysis: Looks set to revisit $66.20-30 resistance on Friday’s bullish Doji

  • WTI picks up bids, rises the most in four days.
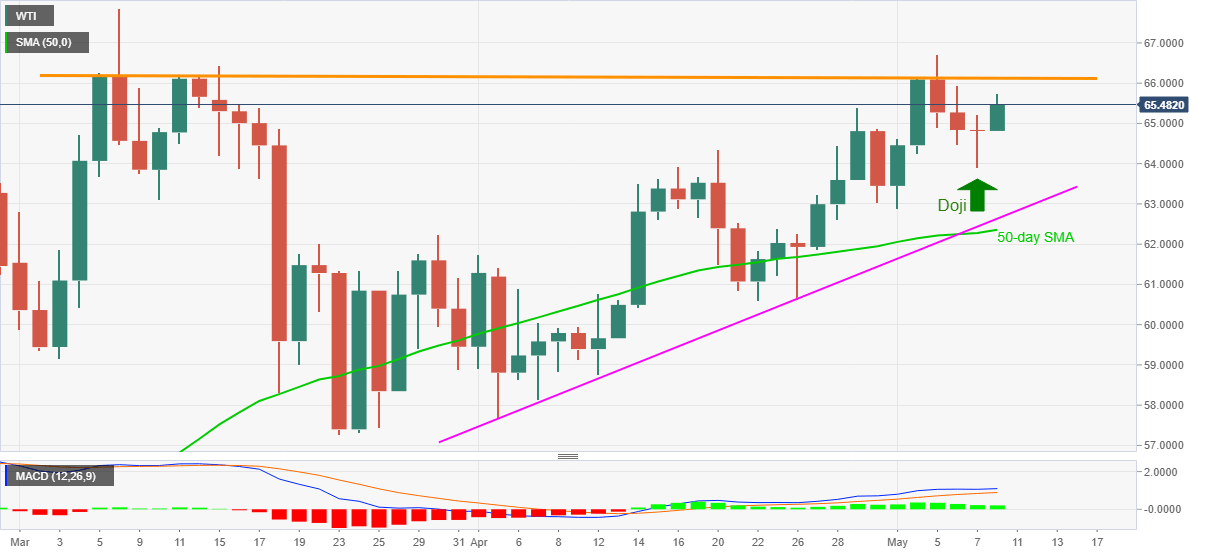
  • Bullish candlestick, upbeat MACD direct traders to the key hurdle.
  • Monthly support line, 50-day SMA restrict short-term downside.

WTI remains on the front foot, up 0.89% intraday near $65.40, as traders in Brussels brace for Monday’s bell. In doing so, the oil benchmark justifies Friday’s bullish Doji candlestick as well as upbeat MACD signals.

Although the latest run-up is set for cross the $66.00 round figure resistance, a horizontal area comprising multiple tops marked since early March around $66.20-30 will be a tough nut to crack for the oil bulls.

Should the barrel of black gold costs more than $66.30, the yearly high surrounding $67.85 will return to the chart.

During the pullback, $64.00 may entertain the short-term WTI sellers ahead of directing them to an ascending support line from April 05, near $62.60.

However, any further weakness past-$62.60 will be tested by a 50-day SMA level of $62.35, if not then the odds of the commodity’s gradual declines to $60.00 psychological magnet can’t be ruled out.

WTI daily chart

Trend: Bullish

Additional important levels

Overview
Today last price65.35
Today Daily Change0.54
Today Daily Change %0.83%
Today daily open64.81
 
Trends
Daily SMA2063.12
Daily SMA5062.28
Daily SMA10058.04
Daily SMA20049.82
 
Levels
Previous Daily High65.21
Previous Daily Low63.9
Previous Weekly High66.7
Previous Weekly Low62.88
Previous Monthly High65.4
Previous Monthly Low57.66
Daily Fibonacci 38.2%64.4
Daily Fibonacci 61.8%64.71
Daily Pivot Point S164.07
Daily Pivot Point S263.32
Daily Pivot Point S362.75
Daily Pivot Point R165.38
Daily Pivot Point R265.95
Daily Pivot Point R366.7

Author

Anil Panchal

Anil Panchal

FXStreet

Anil Panchal has nearly 15 years of experience in tracking financial markets. With a keen interest in macroeconomics, Anil aptly tracks global news/updates and stays well-informed about the global financial moves and their implications.

More from Anil Panchal
Share:

Markets move fast. We move first.

Orange Juice Newsletter brings you expert driven insights - not headlines. Every day on your inbox.

By subscribing you agree to our Terms and conditions.

Editor's Picks

EUR/USD softens below 1.1750 amid ECB rate hold expectations

The EUR/USD pair declines to around 1.1730 during the early European session on Wednesday, pressured by renewed US Dollar demand. Nonetheless, the potential downside for the major pair might be limited amid the growing acceptance that the European Central Bank is done cutting interest rates. 

GBP/USD gains ground above 1.3400 on UK PMI optimism

The GBP/USD pair gains momentum to around 1.3425 during the early Asian session on Wednesday. The Pound Sterling edges higher against the Greenback on the upbeat UK preliminary S&P Global Purchasing Managers' Index data. Traders will take more cues from the Fedspeak later on Wednesday. 

Gold advances to near seven-week highs amid US labor market cooling

Gold price extends its upside to near seven-week highs above $4,300 during the Asian trading hours on Wednesday. The precious metal gains momentum as the US labor market remains relatively resilient but shows signs of slowing. The mixed US employment report for November reinforces bets of further rate cuts by the US Federal Reserve and weighs on the US Dollar.

Bitcoin, Ethereum and Ripple extend correction as bearish momentum builds

Bitcoin, Ethereum, and Ripple remain under pressure as the broader market continues its corrective phase into midweek. The weak price action of these top three cryptocurrencies by market capitalization suggests a deeper correction, as momentum indicators are beginning to tilt bearish.

Ukraine-Russia in the spotlight once again

Since the start of the week, gold’s price has moved lower, but has yet to erase the gains made last week. In today’s report we intend to focus on the newest round of peace talks between Russia and Ukraine, whilst noting the release of the US Employment data later on day and end our report with an update in regards to the tensions brewing in Venezuela.

BNB Price Forecast: BNB slips below $855 as bearish on-chain signals and momentum indicators turn negative

BNB, formerly known as Binance Coin, continues to trade down around $855 at the time of writing on Tuesday, after a slight decline the previous day. Bearish sentiment further strengthens as BNB’s on-chain and derivatives data show rising retail activity.