|

WTI Price Analysis: Keeps trading below weekly rising trend line, 50-HMA

  • WTI fades bounces off three-day-old support line, stays above $45.00.
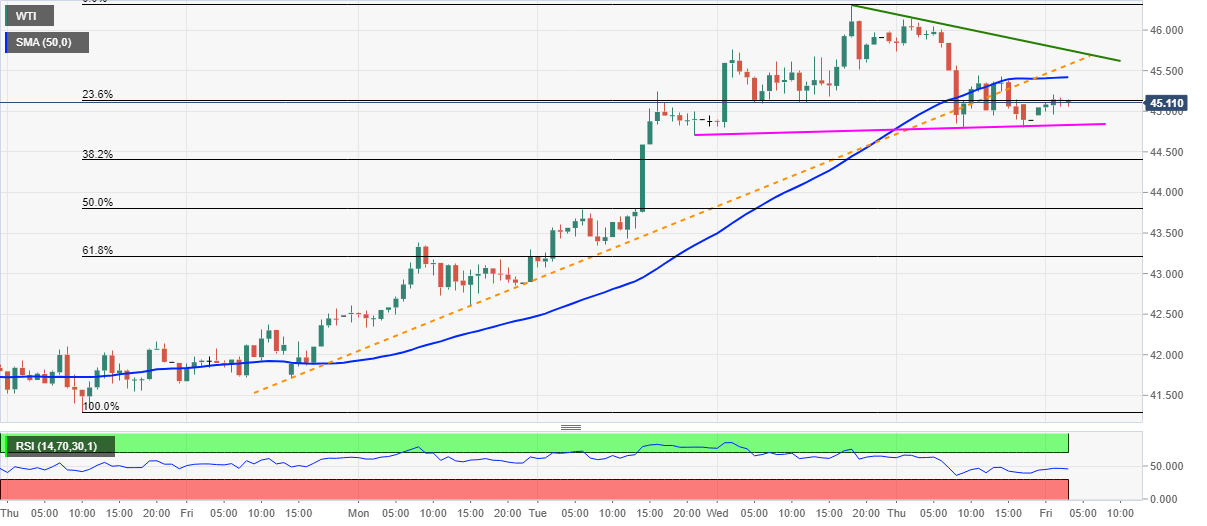
  • Normal RSI conditions suggest further recovery, 50% of Fibonacci retracement lures bears below trend line support.

Having initially extended the previous day’s recovery mover from $44.79, WTI eases to $45.10 during early Friday. In doing so, the energy benchmark keeps the downside break of 50-HMA and an ascending trend line from November 20.

However, an immediate support line from Tuesday restricts the quote’s short-term declines, around $44.83, before the previous day’s low near $44.79.

While RSI conditions suggest further consolidation of losses towards 50-HMA and previous support line, respectively around $45.40 and $45.60, a two-day-long resistance line near $45.75/80 could challenge the energy bulls afterward.

In a case where the oil prices rise beyond $45.80, the recently flashed multi-month high of $46.30 and March month’s high near $48.85 gains market attention.

Alternatively, a downside break below $44.79 will eye 50% Fibonacci retracement of November 19-25 advances, at $43.80.

Should there be further declines below $43.80, November 23 high near $43.40 may return to the charts.

WTI hourly chart

Trend: Further recovery expected

Additional important levels

Overview
Today last price45.11
Today Daily Change0.22
Today Daily Change %0.49%
Today daily open44.89
 
Trends
Daily SMA2041.01
Daily SMA5040.34
Daily SMA10040.79
Daily SMA20036.86
 
Levels
Previous Daily High46.14
Previous Daily Low44.8
Previous Weekly High42.68
Previous Weekly Low40.36
Previous Monthly High41.93
Previous Monthly Low35.08
Daily Fibonacci 38.2%45.31
Daily Fibonacci 61.8%45.63
Daily Pivot Point S144.41
Daily Pivot Point S243.93
Daily Pivot Point S343.07
Daily Pivot Point R145.76
Daily Pivot Point R246.62
Daily Pivot Point R347.1

Author

Anil Panchal

Anil Panchal

FXStreet

Anil Panchal has nearly 15 years of experience in tracking financial markets. With a keen interest in macroeconomics, Anil aptly tracks global news/updates and stays well-informed about the global financial moves and their implications.

More from Anil Panchal
Share:

Markets move fast. We move first.

Orange Juice Newsletter brings you expert driven insights - not headlines. Every day on your inbox.

By subscribing you agree to our Terms and conditions.

Editor's Picks

EUR/USD climbs toward 1.1800 as US employment data weighs on USD

EUR/USD gains traction and rises toward 1.1800 in the second half of the day on Tuesday. The US Dollar weakens and helps the pair stretch higher after the employment report showed that Nonfarm Payrolls declined by 105,000 in October before rising by 64,000 in November.

GBP/USD clings to gains above 1.3400

GBP/USD stays in positive territory above 1.3400 on Tuesday. The British Pound benefits from upbeat PMI data, while the US Dollar struggles to find demand following the mixed employment figures, allowing the pair to hold its ground.

Gold recovers to $4,300 area as markets assess US jobs data

Gold reverses its direction and recovers to the $4,300 area after spending the first half of the day under bearish pressure. The renewed US Dollar weakness after the jobs report showed that the Unemployment Rate climbed to 4.6% in November helps XAU/USD erase its losses.

US Nonfarm Payrolls expected to point to cooling labor market in November

The United States Bureau of Labor Statistics will release the delayed Nonfarm Payrolls (NFP) data for October and November on Tuesday at 13:30 GMT. Economists expect Nonfarm Payrolls to rise by 40,000 in November. The Unemployment Rate is likely to remain unchanged at 4.4% during the same period.

Ukraine-Russia in the spotlight once again

Since the start of the week, gold’s price has moved lower, but has yet to erase the gains made last week. In today’s report we intend to focus on the newest round of peace talks between Russia and Ukraine, whilst noting the release of the US Employment data later on day and end our report with an update in regards to the tensions brewing in Venezuela.

BNB Price Forecast: BNB slips below $855 as bearish on-chain signals and momentum indicators turn negative

BNB, formerly known as Binance Coin, continues to trade down around $855 at the time of writing on Tuesday, after a slight decline the previous day. Bearish sentiment further strengthens as BNB’s on-chain and derivatives data show rising retail activity.