|

WTI Price Analysis: Hourly RSI shows corrective bounce has ended

  • WTI trades near $37.80 versus $38.45 during the overnight trade. 
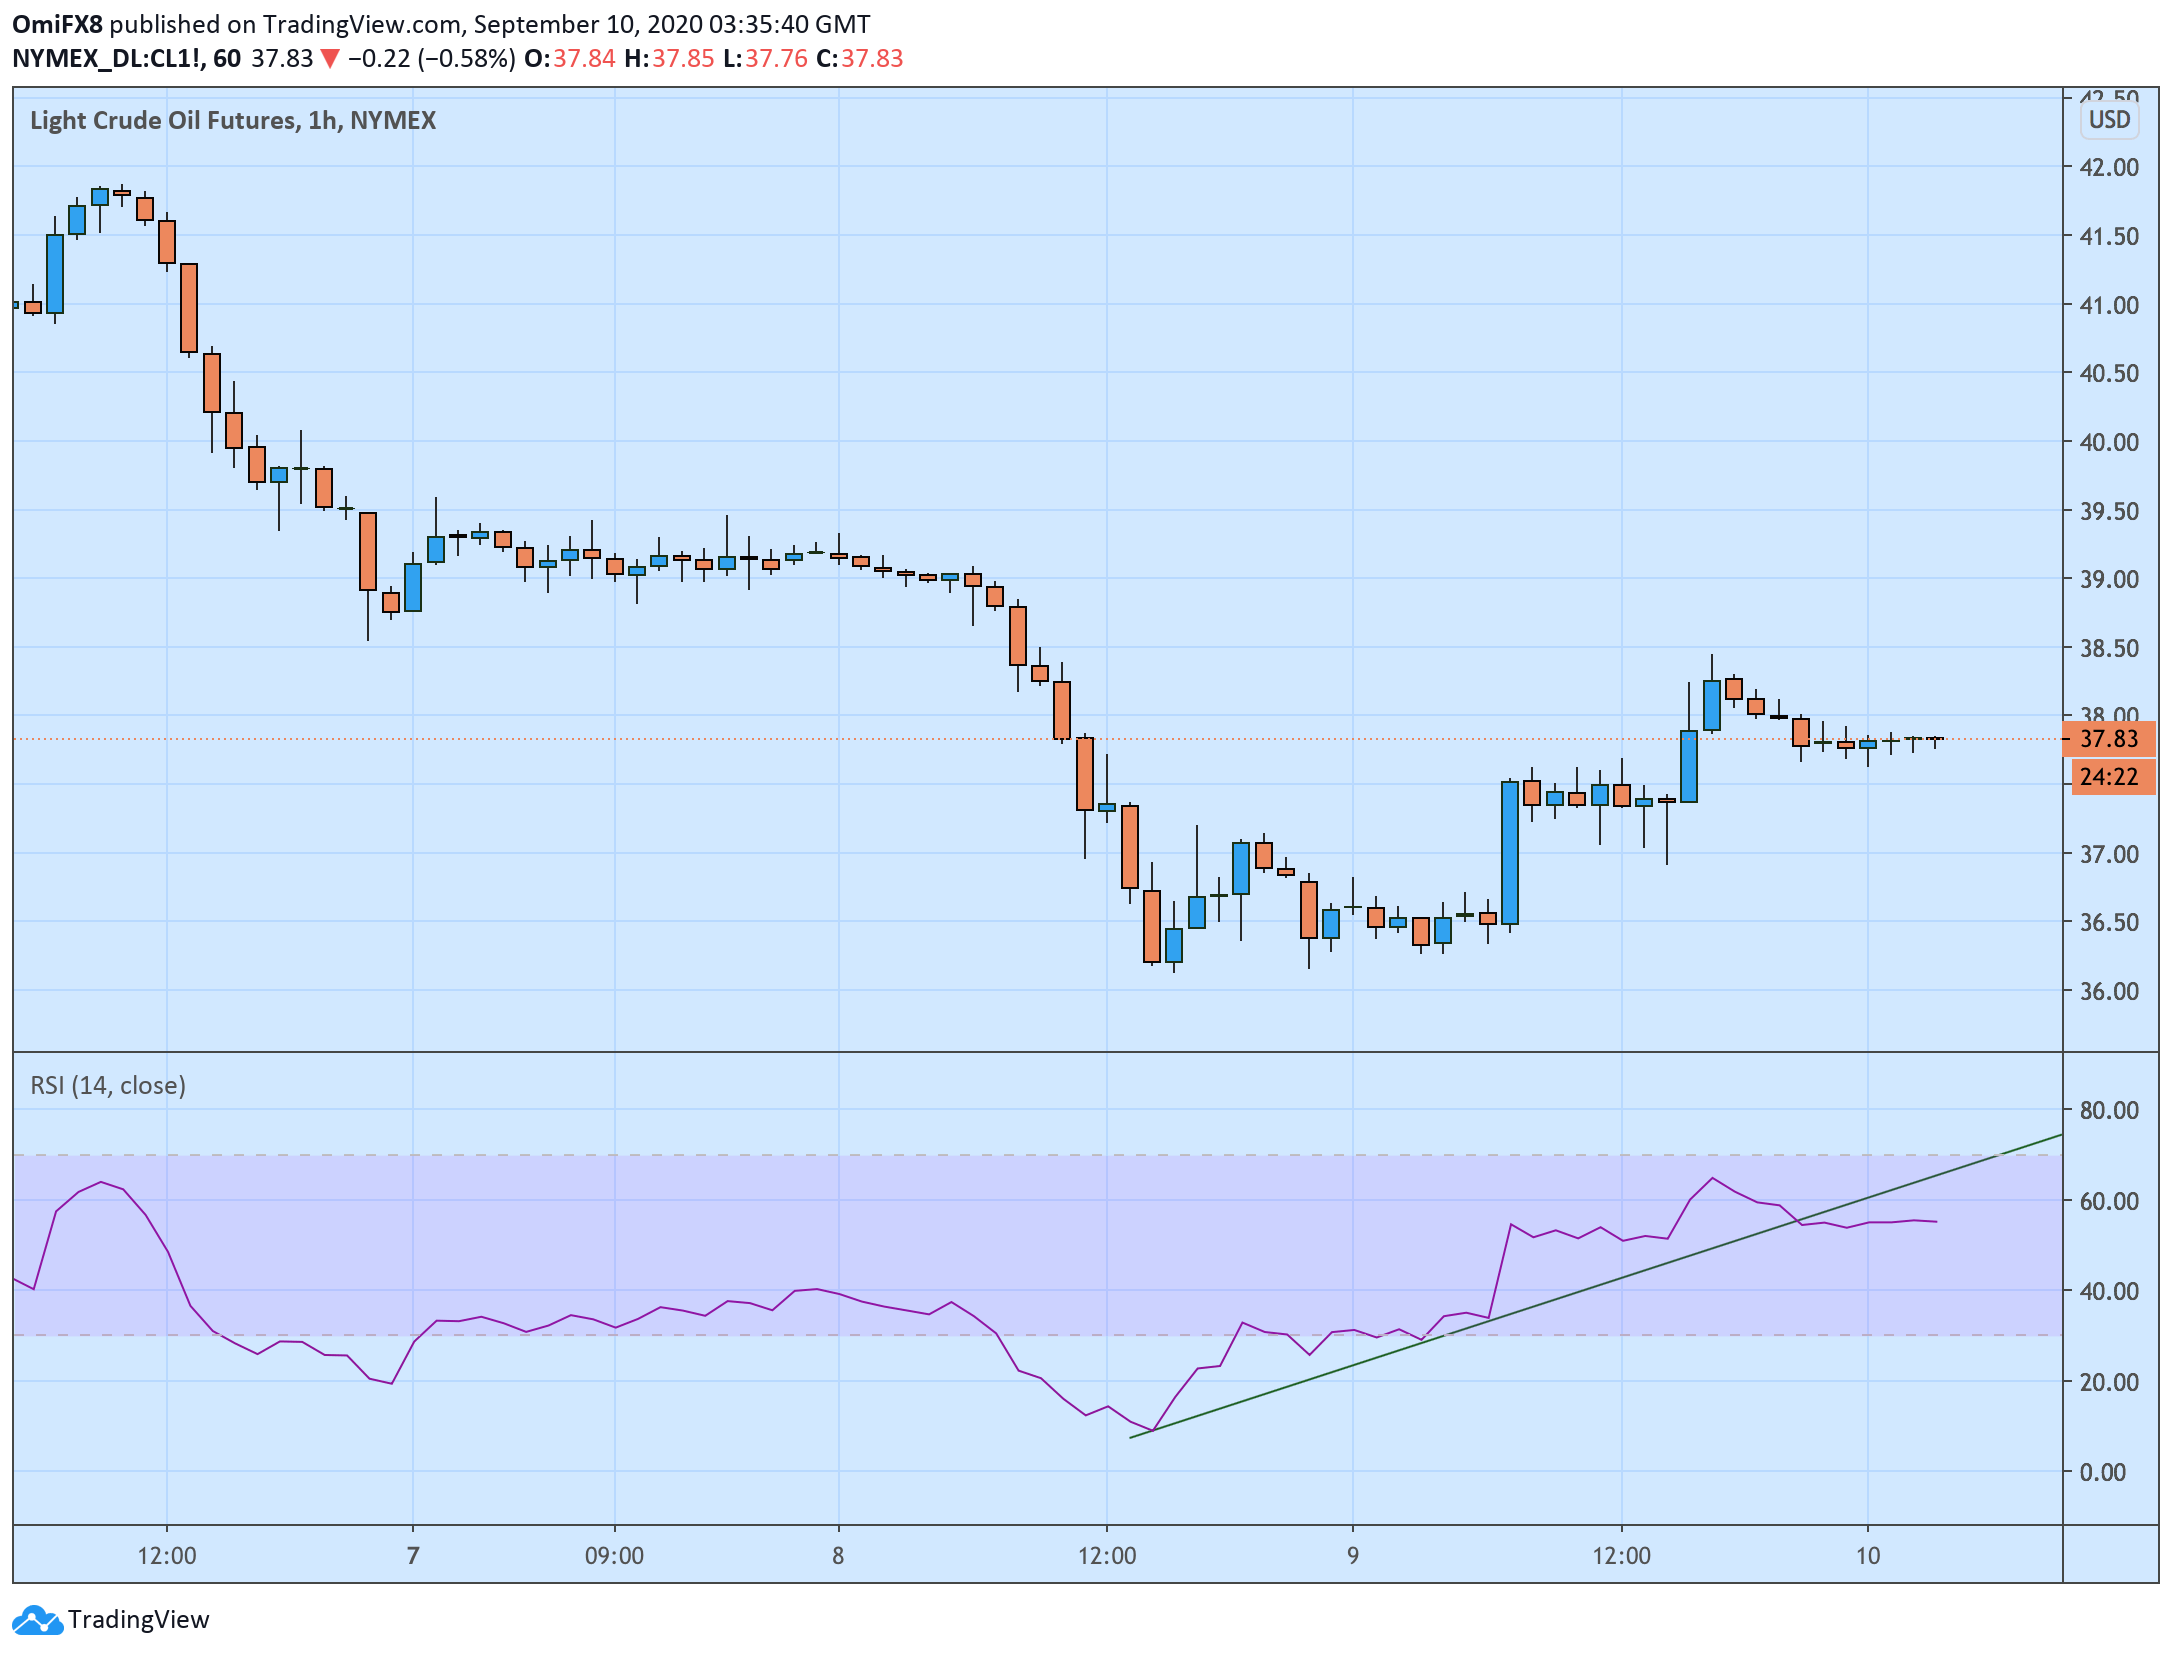
  • The hourly chart shows an end of corrective bounce from $37.00. 

West Texas Intermediate (WTI) crude is currently trading near $37.80, representing a 0.7% decline on the day. 

The hourly chart relative strength index has dived out of an ascending trendline, indicating an end of the black gold's bounce from weekly lows near $37.00. 

The daily chart studies remain biased in favor of the bears. For instance, the 5- and 10-day simple moving averages continue to trend south, while the 14-day RSI hovers in bearish territory below 50. 

As such, a re-test of $37.00 looks likely. Supporting the bearish case is the fact that major trading firms are again booking offshore oil storage tanks, a sign of weakening of demand. 

A close above the descending 10-day SMA, currently at $40.66, is needed to invalidate the bearish outlook

Hourly chart

Trend: Bearish

Technical levels

WTI

Overview
Today last price37.80
Today Daily Change0.40
Today Daily Change %-0.55%
Today daily open38.04
 
Trends
Daily SMA2041.92
Daily SMA5041.45
Daily SMA10036.75
Daily SMA20041.57
 
Levels
Previous Daily High38.69
Previous Daily Low36.49
Previous Weekly High43.7
Previous Weekly Low39.61
Previous Monthly High43.86
Previous Monthly Low39.75
Daily Fibonacci 38.2%37.85
Daily Fibonacci 61.8%37.33
Daily Pivot Point S136.79
Daily Pivot Point S235.55
Daily Pivot Point S334.6
Daily Pivot Point R138.99
Daily Pivot Point R239.93
Daily Pivot Point R341.18

Author

Omkar Godbole

Omkar Godbole

FXStreet Contributor

Omkar Godbole, editor and analyst, joined FXStreet after four years as a research analyst at several Indian brokerage companies.

More from Omkar Godbole
Share:

Markets move fast. We move first.

Orange Juice Newsletter brings you expert driven insights - not headlines. Every day on your inbox.

By subscribing you agree to our Terms and conditions.

Editor's Picks

EUR/USD declines toward 1.1700 on solid USD recovery

EUR/USD turns south and declines toward 1.1700 on Wednesday. A solid comeback staged by the US Dollar weighs heavily on the pair, as traders look to USD short covering ahead of US CPI on Thursday. However, the downside could be capped by hawkish ECB expectations. 

GBP/USD slides toward 1.3300 after softer-than-expected UK inflation data

GBP/USD has come under intense selling pressure, eyeing 1.3300 in the European session on Wednesday. The UK annual headline and core CPI rose by 3.2% each, missing estimates of 3.5% and 3.4%, respectively, reaffirming dovish BoE expectations and smashing the Pound Sterling across the board. 

Gold clings to modest gains above $4,300

Following Tuesday's volatile action, Gold regains its traction on Wednesday and trades in positive territory above $4,300. While the buildup in the USD recovery momentum caps XAU/USD's upside, the cautious market stance helps ithe pair hold its ground.

Bitcoin risks deeper correction as ETF outflows mount, derivative traders stay on the sidelines

Bitcoin (BTC) remains under pressure, trading below $87,000 on Wednesday, nearing a key support level. A decisive daily close below this zone could open the door to a deeper correction.

Monetary policy: Three central banks, three decisions, the same caution

While the Fed eased its monetary policy on 10 December for the third consecutive FOMC meeting, without making any guarantees about future action, the BoE, the ECB and the BoJ are holding their respective meetings this week. 

AAVE slips below $186 as bearish signals outweigh the SEC investigation closure

Aave (AAVE) price continues its decline, trading below $186 at the time of writing on Wednesday after a rejection at the key resistance zone. Derivatives positioning and momentum indicators suggest that bearish forces still dominate in the near term.