|

WTI Price Analysis: Falling wedge breakout favors Oil bulls, $77.00 guards immediate upside

  • WTI picks up bids to extend previous day’s rebound from three-week low.
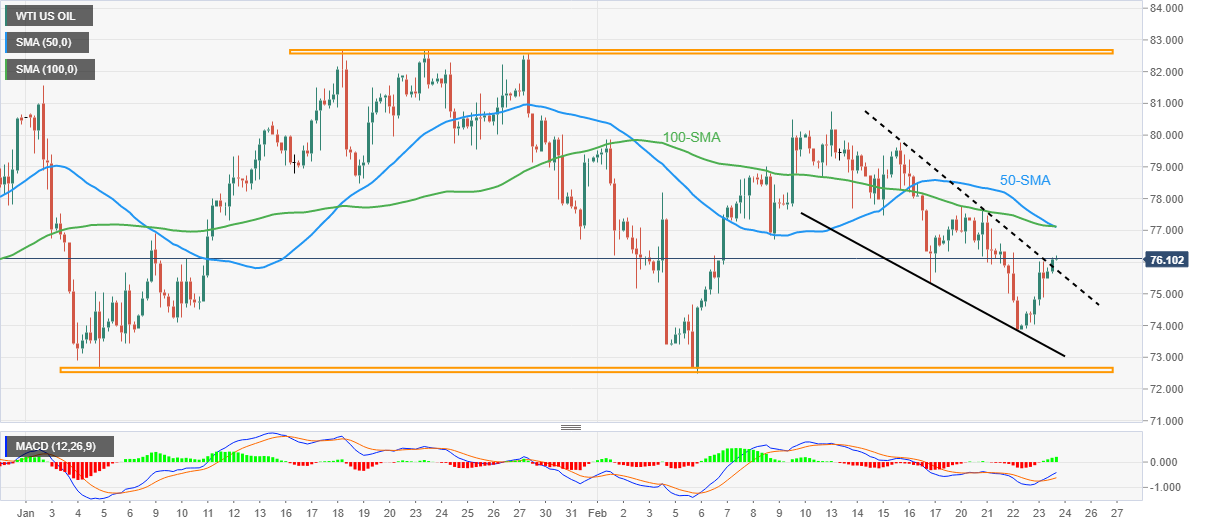
  • Confirmation of bullish chart pattern, upbeat MACD signals favor Oil buyers.
  • Convergence of 50-SMA, 100-SMA appears short-term key upside hurdle.

WTI crude oil bulls attack $76.00 during early Friday, around $76.10 by the press time, while stretching the previous day’s rebound from a three-week low. In doing so, black gold justifies confirmation of the bullish chart pattern, namely the falling wedge, as well as the bullish MACD signals.

As a result, the energy benchmark is well-set to extend the latest rebound towards a convergence of 50-SMA and 100-SMA, near $77.00-10.

However, multiple hurdles surrounding the $80.00 psychological magnet could challenge the WTI bulls past $77.10.

It’s worth noting that the falling wedge confirmation’s theoretical target appears $81.70. Following that, a five-week-long horizontal resistance area surrounding $82.60-70 could restrict the commodity’s further advances.

On the flip side, the stated wedge’s top line acts as an immediate support line, close to $75.80 by the press time.

Should the quote drops below $75.80, the recent swing low near $73.80 may act as a buffer before highlighting the area comprising the lows marked so far in 2023, close to $72.50-70.

Overall, Oil price regains buyer’s confidence even if the road toward the north appears long and bumpy.

WTI: Four-hour chart

Trend: Limited upside expected

Additional important levels

Overview
Today last price76.1
Today Daily Change0.49
Today Daily Change %0.65%
Today daily open75.61
 
Trends
Daily SMA2077.37
Daily SMA5077.98
Daily SMA10080.41
Daily SMA20088.77
 
Levels
Previous Daily High76.03
Previous Daily Low73.88
Previous Weekly High80.75
Previous Weekly Low75.34
Previous Monthly High82.68
Previous Monthly Low72.64
Daily Fibonacci 38.2%75.21
Daily Fibonacci 61.8%74.7
Daily Pivot Point S174.32
Daily Pivot Point S273.03
Daily Pivot Point S372.18
Daily Pivot Point R176.47
Daily Pivot Point R277.32
Daily Pivot Point R378.61

Author

Anil Panchal

Anil Panchal

FXStreet

Anil Panchal has nearly 15 years of experience in tracking financial markets. With a keen interest in macroeconomics, Anil aptly tracks global news/updates and stays well-informed about the global financial moves and their implications.

More from Anil Panchal
Share:

Editor's Picks

EUR/USD appears supported by the 200-day SMA, for now

Following an early pullback to multi-week lows near 1.1670, EUR/USD now manages to reclaim the 1.1700 region as the NA session draws to a close on Monday. The steep retracement in spot follows the equally strong move higher in the US Dollar, as investors continue to assess the geopolitical landscape in the wake of the US and Israel attacks on Iran.


GBP/USD hits new yearly lows near 1.3300

GBP/USD adds to the recent bearish tone, approaching to the key 1.3300 support to reach fresh YTD troughs against the backdrop of the robust performance of the US Dollar. Indeed, Cable’s decline comes amid the firm demand for the safe-haven space in the wake of the US and Israel attacks to Iran.

Gold eases some ground, approaches $5,300

Gold now surrenders part of the earlier advance, reshifting its attenton to the $5,300 zone per troy ounce at the beginning of the week. Indeed, the yellow metal’s firm performance appears propped up by incresing geopolitical jitters in the Middle East, which at the same time fuels the demand for the safe-haven space.

Ethereum Price Forecast: BitMine lifts ETH holdings to 4.47M, Lee predicts geopolitical impact on markets

Ethereum (ETH) treasury firm BitMine Immersion (BMNR) bought another 50,928 ETH last week, sending its stash of the top altcoin to 4.47 million ETH worth about $8.9 billion at the time of publication.

The Fed is finally talking about AI – Here's why it matters for the US Dollar

AI is moving from earnings calls into the heart of monetary policy discussions, forcing Federal Reserve officials to confront a new question: How to act if AI reshapes inflation, employment and interest rates at the same time?

Grass 20% bullish breakout defies broader market weakness

Grass (GRASS) is edging up above $0.30 at the time of writing on Monday. The token’s notable 20% intraday surge stands out amid heightened volatility in the broader crypto market.