WTI Price Analysis: Drops further below 100/50-day EMA confluence towards $38.00
- WTI extends pullback from the monthly high of $39.55.
- Early-October lows lure the bears, the falling trend line from August 26 adds to the upside barriers.

WTI drops to $38.73, down 0.91% intraday, during early Friday. The black gold surged to the highest since October 27 the previous day, before taking a U-turn from a join of 50-day and 100-day EMAs.
Considering the downbeat conditions of MACD histogram, coupled with the sustained reversal from the key EMAs, oil sellers are likely targeting the October 02 low of $36.79 during the further declines.
However, the $38.00 threshold can offer intermediate support whereas September’s bottom surrounding $36.40 acts as an extra downside filter.
On the flip side, a daily closing beyond the $39.50 resistance confluence will be challenged by the $40.00 psychological magnet.
If at all the commodity buyers manage to cross $40.00 on the daily closing, a multi-day-old resistance line, at $41.30, will raise bars for the quote’s further upside.
WTI daily chart
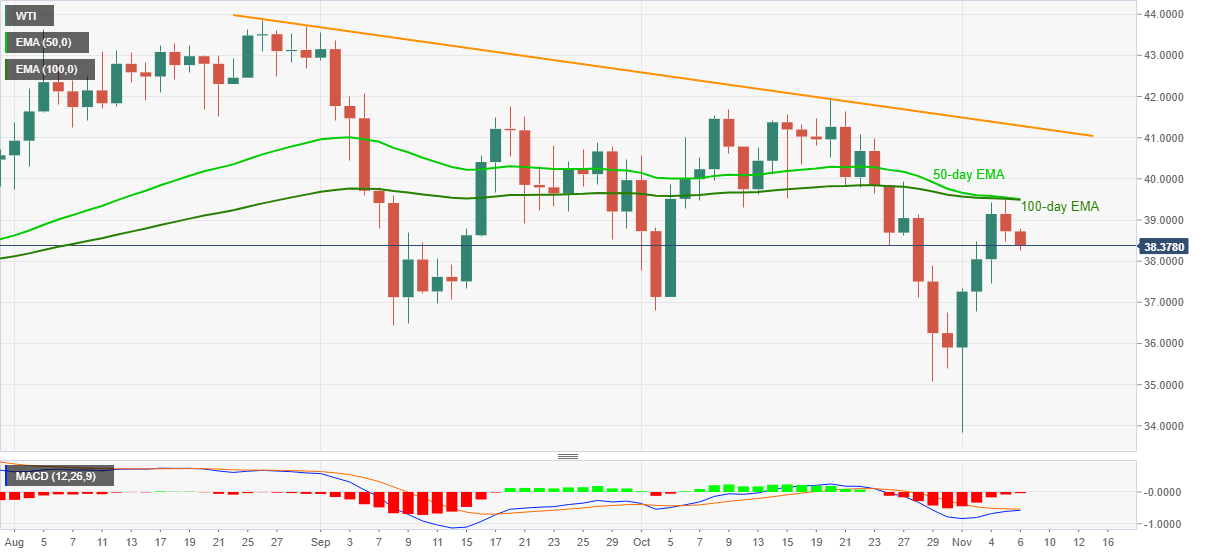
Trend: Bearish
Author

Anil Panchal
FXStreet
Anil Panchal has nearly 15 years of experience in tracking financial markets. With a keen interest in macroeconomics, Anil aptly tracks global news/updates and stays well-informed about the global financial moves and their implications.


