|

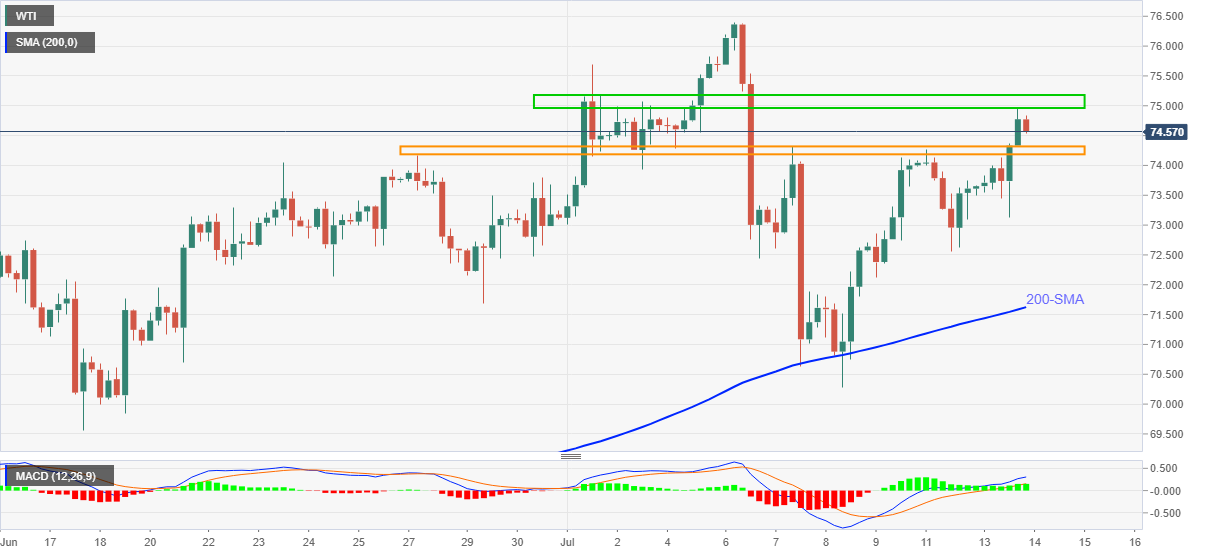
WTI Price Analysis: Consolidates gains around $74.50 post API inventories

  • WTI pulls back from one-week high on weaker-than-previous draw in weekly API stockpile.
  • Bullish MACD, sustained trading beyond 200-SMA back buyers to battle monthly horizontal hurdle.
  • 12-day-old support region lures intraday sellers, further downside has a bumpy road to the south.

WTI retreats to $74.58, down 0.17% intraday, amid the early Asian session trading on Wednesday. In doing so, the oil benchmark steps back from a one-week high, flashed the previous day, on soft inventory draw, per industry reports.

Weekly Crude Oil Stocks data from the American Petroleum Institute (API) reports -4.079M of inventories, versus -7.983M prior, for the week ended on July 09.

The weaker than the previous draw in stockpiles allowed bulls to take a breather from a two-week-long horizontal area surrounding $75.00–75.20.

Even so, the corrective declines remain less destructive to even the short-term uptrend until the quote stays beyond the $74.30–20 zone, comprising multiple levels marked since June 28.

In a case where the oil sellers break $74.20 support, the $74.00 threshold and the weekly bottom close to $72.55 will test the further downside ahead of highlighting the 200-SMA level of $71.62 for the WTI bears.

It’s worth noting that the bullish MACD can keep energy buyers hopeful should the prices remain above the key SMA, a break of which will challenge the monthly low close to $70.30.

Meanwhile, an upside clearance of $75.20 will direct WTI bulls to the multi-month high of $76.40, marked last week. However, any further advances will be tested by the year 2018 top of $76.80.

WTI: Four-hour chart

Trend: Bullish

Additional important levels

Overview
Today last price74.58
Today Daily Change0.96
Today Daily Change %1.30%
Today daily open73.62
 
Trends
Daily SMA2073.02
Daily SMA5069.2
Daily SMA10065.63
Daily SMA20056.4
 
Levels
Previous Daily High74.27
Previous Daily Low72.56
Previous Weekly High76.4
Previous Weekly Low70.28
Previous Monthly High74.17
Previous Monthly Low66.78
Daily Fibonacci 38.2%73.21
Daily Fibonacci 61.8%73.62
Daily Pivot Point S172.7
Daily Pivot Point S271.77
Daily Pivot Point S370.99
Daily Pivot Point R174.41
Daily Pivot Point R275.19
Daily Pivot Point R376.12

Author

Anil Panchal

Anil Panchal

FXStreet

Anil Panchal has nearly 15 years of experience in tracking financial markets. With a keen interest in macroeconomics, Anil aptly tracks global news/updates and stays well-informed about the global financial moves and their implications.

More from Anil Panchal
Share:

Editor's Picks

EUR/USD gathers traction, approaches 1.1800

EUR/USD manages to reverse Tuesday’s pullback, advancing to two-day highs near the 1.1800 hurdle in the latter part of Wednesday’s session. The pair’s decent uptick comes on the back of the modest retracement in the US Dollar, as investors continue to closely follow developments on the trade front and news from the White House in the wake of President Trump’s SOTU speech.

GBP/USD challenges multi-day highs near 1.3530

GBP/USD leaves behind the previous day’s decline and regains fresh upside traction on Wednesday, surpassing the 1.3500 barrier in a context of a modest decline in the Greenback and a generalised improved mood in the risk-linked space. Meanwhile, the US tariff narrative continues to dictate the mood among market participants after Presidet Trump’s SOTU speech failed to surprise markets.

Gold remains bid and close to $5,200

Gold buyers are returning to the fold on Wednesday, targeting the $5,200 area and possibly beyond, after Tuesday’s corrective dip from monthly highs. The rebound in the precious metal comes as the US Dollar loses traction, with Trump’s SOTU speech offering little fresh direction and AI-related nerves continuing to ease.

Crypto Today: Bitcoin, Ethereum, XRP test rebound strength as ETF inflows return

Bitcoin, Ethereum and Ripple are gaining traction at the time of writing on Wednesday, amid persistent market doldrums. The Crypto King is up over 2% intraday, trading above $65,000 from the day’s opening of $64,058.

Nvidia earnings to influence AI trade and broader market sentiment

For the last three years, Nvidia has been the engine of the AI boom, and now Wall Street is watching to see whether that momentum can keep going. High-growth stocks have been struggling to maintain their bullish trend in 2026.

Cosmos Hub Price Forecast: ATOM rebounds slightly, bearish outlook remains intact

Cosmos Hub (ATOM) price rebounds, trading above $2.05 at the time of writing on Wednesday, after undergoing a sharp correction since last week. Weakening on-chain and derivatives data support a bearish outlook, while technical analysis remains unfavorable.