|

WTI Price Analysis: Clings to 200-bar SMA around $40.00 in Asia

  • WTI struggles to extend recovery moves from $39.48.
  • Falling trend line from September 04 also challenges the oil bulls.
  • Five-week-old horizontal support will lure bears below the $39.00 threshold.

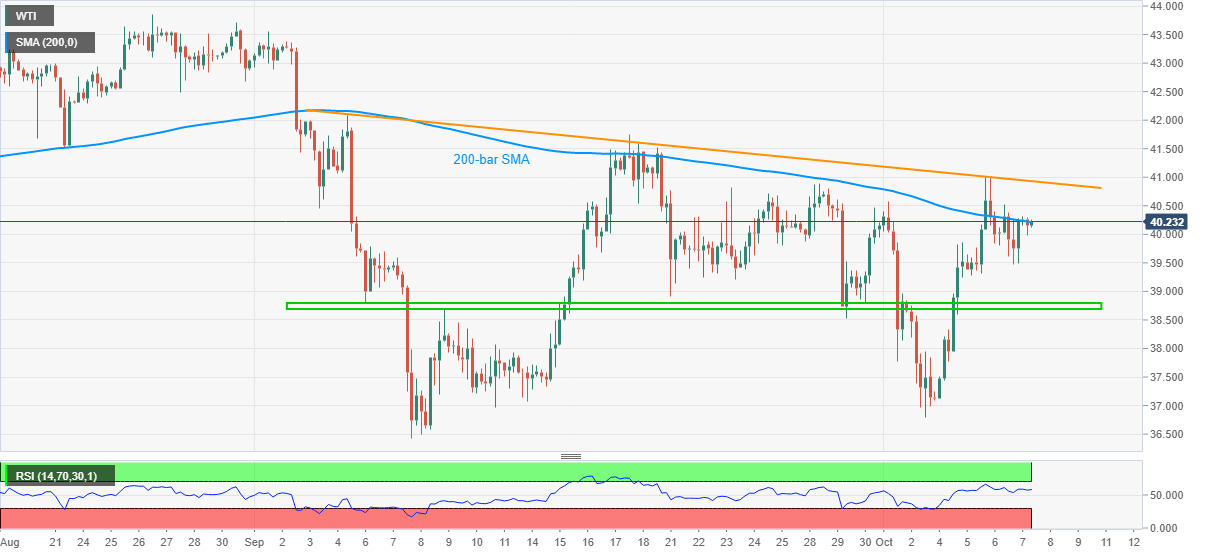
WTI picks up bids near $40.23 while heading into Thursday’s European session. In doing so, the black gold confronts 200-bar SMA after its positive performance on Wednesday.

While normal RSI conditions and risk-on mood favors the commodity to cross the immediate upside hurdle near $40.25, it’s further advances will be tamed by a falling trend line from the early September, currently around $40.95.

During the quote’s break past-$40.95, the $41.00 round-figure and September 18 top close to $41.45 can entertain the oil buyers.

On the contrary, a downside break of yesterday’s low of $39.48 can quickly direct WTI sellers toward a horizontal region between $38.70 and $38.80 that comprises multiple technical levels since September 04.

Also acting as the key support will be the monthly low of $36.79 and the September month’s bottom surrounding $36.40.

WTI four-hour chart

Trend: Further recovery expected

Additional important levels

Overview
Today last price40.22
Today Daily Change-0.01
Today Daily Change %-0.02%
Today daily open40.23
 
Trends
Daily SMA2039.45
Daily SMA5040.88
Daily SMA10039.82
Daily SMA20039.57
 
Levels
Previous Daily High40.52
Previous Daily Low39.48
Previous Weekly High40.88
Previous Weekly Low36.8
Previous Monthly High43.56
Previous Monthly Low36.43
Daily Fibonacci 38.2%40.13
Daily Fibonacci 61.8%39.88
Daily Pivot Point S139.63
Daily Pivot Point S239.03
Daily Pivot Point S338.59
Daily Pivot Point R140.68
Daily Pivot Point R241.12
Daily Pivot Point R341.72

Author

Anil Panchal

Anil Panchal

FXStreet

Anil Panchal has nearly 15 years of experience in tracking financial markets. With a keen interest in macroeconomics, Anil aptly tracks global news/updates and stays well-informed about the global financial moves and their implications.

More from Anil Panchal
Share:

Editor's Picks

EUR/USD remains offered below 1.1600, seems vulnerable near multi-month low

The EUR/USD pair struggles to capitalize on the overnight bounce from the 1.1530 region, or the lowest level since November 2025, and lower for the third consecutive day on Wednesday. Spot prices slide back below the 1.1600 mark during the Asian session and seem vulnerable to slide further.

GBP/USD slips below key averages as geopolitical risks mount

GBP/USD fell about 0.35% on Tuesday, settling around 1.3350 after slipping below the 200-day Exponential Moving Average for the first time since early December. The pair has pulled back sharply from its late-January high near 1.3870, shedding over 500 pips in a series of lower highs and lower lows. 

Gold rebounds ahead of US ADP, will it last?

Gold finds renewed Asian bids and retests $5,230 early Wednesday after the heavy sell-off on Tuesday. The US Dollar stands tall amid escalating Middle East tensions and reduced dovish Fed expectations. Gold defends $5,000 or 50% Fibo level after facing rejection at the 78.6% Fibo resistance at $5,342 amid bullish RSI.  

Ethereum: Whales step up buying as short positions contract

After holding firm heading into the last weekend, Ethereum whales have returned to action, pouncing on the volatility stemming from escalating military actions between the US and Iran.

Energy shock 2.0: Why rising Gas prices could hit the Euro

Even without a confirmed, sustained disruption, the mere risk to a key global energy chokepoint is enough to inject a significant premium into European Gas markets. And for the Euro, that matters.

Ripple falters amid sell-off jitters and negative funding rates

Ripple (XRP) has come under pressure, drifting lower to $1.35 at the time of writing on Tuesday. The over 2% correction looks poised to erase the previous day’s gains, which lifted the remittance token to $1.42.