WTI Price Analysis: Buyers can ignore recent retreat to $80.00


  • WTI crude oil retreats from one-week high to snap three-day uptrend.
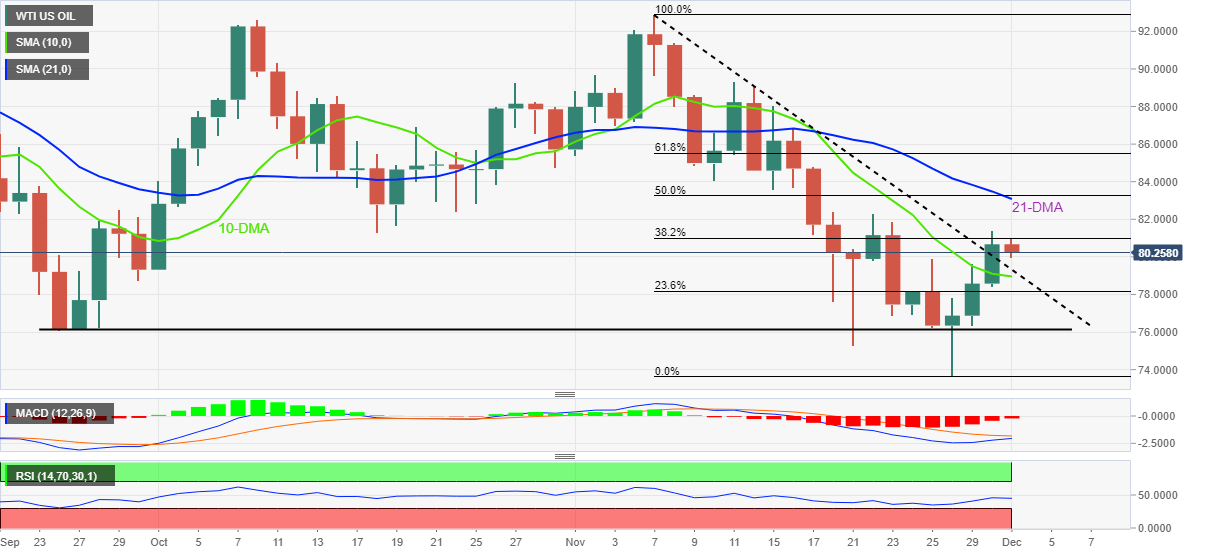
  • Sustained trading beyond monthly resistance line, now support, joins 10-DMA breakout to favor bulls.
  • 21-DMA, 50% Fibonacci retracement level adds to the upside filters.

WTI crude oil prints the first intraday loss of the week as bulls step back to $80.00 after renewing the weekly top during early Thursday.

In doing so, the black gold pares the previous day’s upside break of a downward-sloping resistance line from November 07, now support around $79.30.

Even if the WTI bears manage to conquer the previous resistance near $79.30, the oil sellers will find it difficult to keep the reins unless successfully breach the 10-DMA level surrounding $78.95.

Following that, a southward trajectory towards the horizontal area comprising the lows marked since late September, around $76.10, quickly followed by the $76.00 round figure, could test the commodity sellers before directing them to the yearly low marked in the last week near $73.65.

On the contrary, WTI recovery needs validation from the tops marked on November 18 and 22, around $82.30-40.

Even so, a convergence of the 21-DMA and a 50% Fibonacci retracement level of the black gold’s downturn marked in November, around $83.10-30, appears a tough nut to crack for the bulls before taking control.

It should be noted that the receding bearish bias of the MACD and steady RSI keep oil buyers hopeful.

WTI: Daily chart

Trend: Further upside expected

WTI US OIL

Overview
Today last price 80.2
Today Daily Change -0.47
Today Daily Change % -0.58
Today daily open 80.67
 
Trends
Daily SMA20 83.22
Daily SMA50 84.26
Daily SMA100 87.48
Daily SMA200 96.79
 
Levels
Previous Daily High 81.4
Previous Daily Low 78.44
Previous Weekly High 82.3
Previous Weekly Low 75.28
Previous Monthly High 92.92
Previous Monthly Low 73.66
Daily Fibonacci 38.2% 80.27
Daily Fibonacci 61.8% 79.57
Daily Pivot Point S1 78.94
Daily Pivot Point S2 77.21
Daily Pivot Point S3 75.97
Daily Pivot Point R1 81.9
Daily Pivot Point R2 83.13
Daily Pivot Point R3 84.86


Share: Feed news

Information on these pages contains forward-looking statements that involve risks and uncertainties. Markets and instruments profiled on this page are for informational purposes only and should not in any way come across as a recommendation to buy or sell in these assets. You should do your own thorough research before making any investment decisions. FXStreet does not in any way guarantee that this information is free from mistakes, errors, or material misstatements. It also does not guarantee that this information is of a timely nature. Investing in Open Markets involves a great deal of risk, including the loss of all or a portion of your investment, as well as emotional distress. All risks, losses and costs associated with investing, including total loss of principal, are your responsibility. The views and opinions expressed in this article are those of the authors and do not necessarily reflect the official policy or position of FXStreet nor its advertisers. The author will not be held responsible for information that is found at the end of links posted on this page.

If not otherwise explicitly mentioned in the body of the article, at the time of writing, the author has no position in any stock mentioned in this article and no business relationship with any company mentioned. The author has not received compensation for writing this article, other than from FXStreet.

FXStreet and the author do not provide personalized recommendations. The author makes no representations as to the accuracy, completeness, or suitability of this information. FXStreet and the author will not be liable for any errors, omissions or any losses, injuries or damages arising from this information and its display or use. Errors and omissions excepted.

The author and FXStreet are not registered investment advisors and nothing in this article is intended to be investment advice.

Recommended content


Recommended content

Editors’ Picks

EUR/USD edges lower toward 1.0700 post-US PCE

EUR/USD edges lower toward 1.0700 post-US PCE

EUR/USD stays under modest bearish pressure but manages to hold above 1.0700 in the American session on Friday. The US Dollar (USD) gathers strength against its rivals after the stronger-than-forecast PCE inflation data, not allowing the pair to gain traction.

EUR/USD News

GBP/USD retreats to 1.2500 on renewed USD strength

GBP/USD retreats to 1.2500 on renewed USD strength

GBP/USD lost its traction and turned negative on the day near 1.2500. Following the stronger-than-expected PCE inflation readings from the US, the USD stays resilient and makes it difficult for the pair to gather recovery momentum.

GBP/USD News

Gold struggles to hold above $2,350 following US inflation

Gold struggles to hold above $2,350 following US inflation

Gold turned south and declined toward $2,340, erasing a large portion of its daily gains, as the USD benefited from PCE inflation data. The benchmark 10-year US yield, however, stays in negative territory and helps XAU/USD limit its losses. 

Gold News

Bitcoin Weekly Forecast: BTC’s next breakout could propel it to $80,000 Premium

Bitcoin Weekly Forecast: BTC’s next breakout could propel it to $80,000

Bitcoin’s recent price consolidation could be nearing its end as technical indicators and on-chain metrics suggest a potential upward breakout. However, this move would not be straightforward and could punish impatient investors. 

Read more

Week ahead – Hawkish risk as Fed and NFP on tap, Eurozone data eyed too

Week ahead – Hawkish risk as Fed and NFP on tap, Eurozone data eyed too

Fed meets on Wednesday as US inflation stays elevated. Will Friday’s jobs report bring relief or more angst for the markets? Eurozone flash GDP and CPI numbers in focus for the Euro.

Read more

Forex MAJORS

Cryptocurrencies

Signatures