|

WTI Price Analysis: Bulls cheer upside break of $49.40/45 key resistance at 11-month top

  • WTI reverses the pullback from the highest since February 2020 flashed on Thursday.
  • Sustained trading above key horizontal resistance battles overbought RSI conditions.
  • 21-day SMA restricts immediate downside, bulls eye to refresh multi-month top.

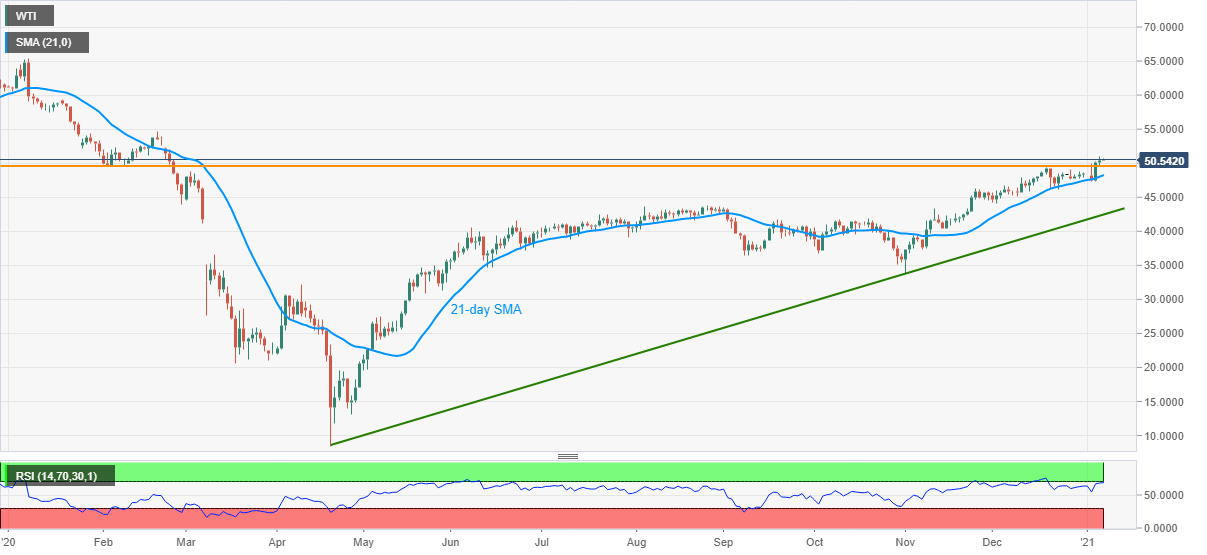
WTI picks up the bids around $50.50, up 0.35% intraday, during Thursday’s Asian trading. The energy benchmark refreshed a multi-month high the previous day before stepping back from $50.95. However, the quote remains above a horizontal area comprising February 2020 low and the previous month’s high, which in turn keeps the energy buyers hopeful.

That said, overbought RSI conditions challenge WTI bulls and hence can delay the run-up target February high of $54.68 while highlighting $51.00 as immediate resistance.

It should be noted that the commodity’s ability to cross $54.68 enables it to challenge the mid-January 2020 low near $57.45 but any further advances won’t hesitate to question the $60.00 and the year 2020 peak of $65.45.

On the downside, a daily closing below $49.45/40 support, previous resistance, will drag the quote towards a 21-day SMA level of $48.25.

Further, WTI’s weakness past-$48.25 will be questioned by the late-November tops close to $46.30 ahead of highlighting an ascending trend line from April 21, 2020, currently around $42.45.

Overall, oil prices are up for challenging the early 2020 tops but overbought RSI and wait for the fundamental decisions, mainly from the US, can keep the momentum choppy.

WTI daily chart

Trend: Bullish

Additional important levels

Overview
Today last price50.49
Today Daily Change0.11
Today Daily Change %0.22%
Today daily open50.38
 
Trends
Daily SMA2048.14
Daily SMA5044.59
Daily SMA10042.47
Daily SMA20038.38
 
Levels
Previous Daily High50.96
Previous Daily Low49.52
Previous Weekly High49
Previous Weekly Low47.57
Previous Monthly High49.43
Previous Monthly Low44.01
Daily Fibonacci 38.2%50.41
Daily Fibonacci 61.8%50.07
Daily Pivot Point S149.61
Daily Pivot Point S248.85
Daily Pivot Point S348.17
Daily Pivot Point R151.05
Daily Pivot Point R251.72
Daily Pivot Point R352.49

Author

Anil Panchal

Anil Panchal

FXStreet

Anil Panchal has nearly 15 years of experience in tracking financial markets. With a keen interest in macroeconomics, Anil aptly tracks global news/updates and stays well-informed about the global financial moves and their implications.

More from Anil Panchal
Share:

Markets move fast. We move first.

Orange Juice Newsletter brings you expert driven insights - not headlines. Every day on your inbox.

By subscribing you agree to our Terms and conditions.

Editor's Picks

EUR/USD climbs toward 1.1800 on broad USD weakness

EUR/USD gathers bullish momentum and advances toward 1.1800 in the second half of the day on Tuesday. The US Dollar weakens and helps the pair stretch higher after the employment report showed that Nonfarm Payrolls declined by 105,000 in October before rising by 64,000 in November.

GBP/USD climbs to fresh two-month high above 1.3400

GBP/USD gains traction in the American session and trades at its highest level since mid-October above 1.3430. The British Pound benefits from upbeat PMI data, while the US Dollar struggles to find demand following the mixed employment figures and weaker-than-forecast PMI prints, allowing the pair to march north.

Gold recovers above $4,300 as markets react to weak US data

Gold trades in positive above $4,300 after spending the first half of the day under bearish pressure. XAU/USD capitalizes on renewed USD weakness after the jobs report showed that the Unemployment Rate climbed to 4.6% in November and the PMI data revealed a loss of growth momentum in the private sector in December. 

US Retail Sales virtually unchanged at $732.6 billion in October

Retail Sales in the United States were virtually unchanged at $732.6 billion in October, the US Census Bureau reported on Tuesday. This print followed the 0.1% increase (revised from 0.3%) recorded in September and came in below the market expectation of +0.1%.

Ukraine-Russia in the spotlight once again

Since the start of the week, gold’s price has moved lower, but has yet to erase the gains made last week. In today’s report we intend to focus on the newest round of peace talks between Russia and Ukraine, whilst noting the release of the US Employment data later on day and end our report with an update in regards to the tensions brewing in Venezuela.

BNB Price Forecast: BNB slips below $855 as bearish on-chain signals and momentum indicators turn negative

BNB, formerly known as Binance Coin, continues to trade down around $855 at the time of writing on Tuesday, after a slight decline the previous day. Bearish sentiment further strengthens as BNB’s on-chain and derivatives data show rising retail activity.