|

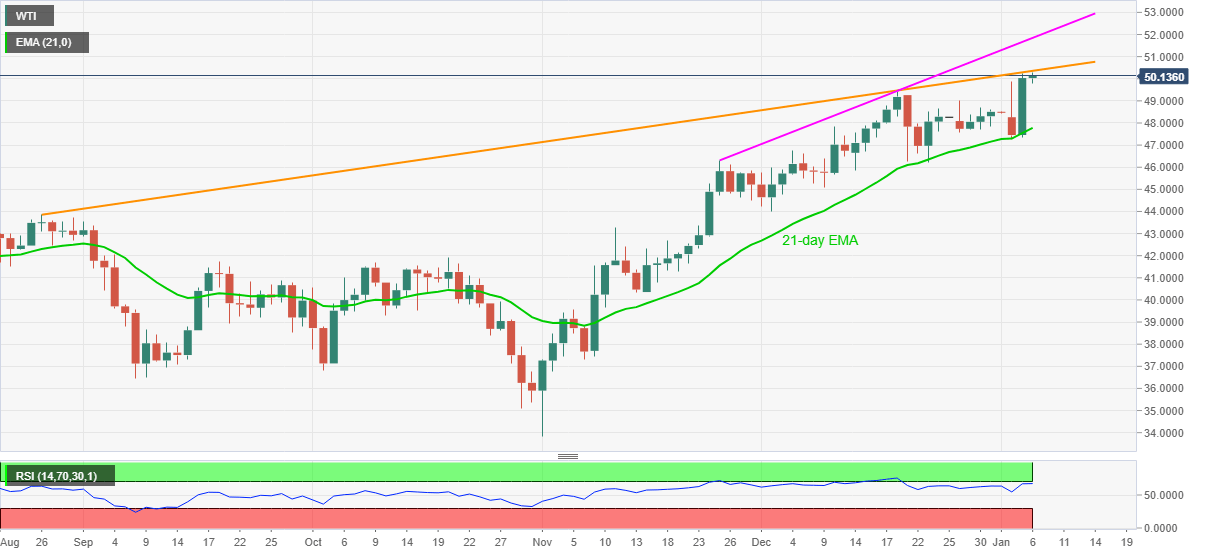
WTI Price Analysis: Bulls attack four-month-old resistance line to regain $50.00

  • WTI prints mild gains after refreshing the highest level since late February 2020.
  • Overbought RSI, key upside hurdle challenge bulls, sellers await entries below 21-day EMA.

Having recently refreshed a 10-month-high with $50.30, WTI takes rounds $50.20, up 0.36% intraday, during early Wednesday. In doing so, the oil benchmark confronts an upward sloping trend line from August 26, 2020, amid overbought RSI.

Considering the strong resistance line and RSI conditions, WTI is likely to witness pullback moves towards the December high of $49.43 for a short-term. However, any further downside will be tested by 21-day EMA near $47.80.

Should oil sellers sneak in below $47.80, highs marked in November and August, respectively around $46.30 and $43.85, will be in the spotlight.

On the contrary, the commodity’s upside break of the immediate resistance line, at $50.35, will direct the WTI bulls to October 2019 low near $51.00.

Also acting as the key resistance is an ascending trend line from November 25, at $51.85 now, a break of which can challenge the February 2020 peak surrounding $54.70.

WTI daily chart

Trend: Pullback expected

Additional important levels

Overview
Today last price50.19
Today Daily Change0.16
Today Daily Change %0.32%
Today daily open50.03
 
Trends
Daily SMA2047.91
Daily SMA5044.33
Daily SMA10042.39
Daily SMA20038.24
 
Levels
Previous Daily High50.24
Previous Daily Low47.33
Previous Weekly High49
Previous Weekly Low47.57
Previous Monthly High49.43
Previous Monthly Low44.01
Daily Fibonacci 38.2%49.13
Daily Fibonacci 61.8%48.44
Daily Pivot Point S148.16
Daily Pivot Point S246.29
Daily Pivot Point S345.25
Daily Pivot Point R151.07
Daily Pivot Point R252.11
Daily Pivot Point R353.98

Author

Anil Panchal

Anil Panchal

FXStreet

Anil Panchal has nearly 15 years of experience in tracking financial markets. With a keen interest in macroeconomics, Anil aptly tracks global news/updates and stays well-informed about the global financial moves and their implications.

More from Anil Panchal
Share:

Editor's Picks

EUR/USD struggles to build on recent rebound, holds above 1.1550

EUR/USD trades marginally lower on the day but holds above 1.1550 in the American session, following Thursday's rebound. The pair holds near its intraday high as the US Dollar remains pressured by hopes the Middle East conflict will soon come to an end.

GBP/USD hovers around 1.3400 as investors await war clarity

GBP/USD remains near its daily open, not far from 1.3400, in the second half of Friday's session. The US Dollar lost its previous intraday strength and weakens as investors await clarity on the US-Iran war.

Gold stabilizes above $4,200 as wait-and-see continues

After rising more than 3% on Thursday, Gold (XAU/USD) stabilized around the $4,200 mark in the American session on Friday. The US dollar seesaws between gains and losses, but remains within familiar levels as investors remain skeptical yet hopeful about a resolution to the Middle East conflict.

Crypto Today: Bitcoin, Ethereum, XRP recovery slows amid incessant capital outflows

The cryptocurrency remains in a broader corrective bias on Friday, despite majors such as Bitcoin (BTC), Ethereum (ETH), and Ripple (XRP) holding slightly higher than early-week support levels.

SpaceX launches 24% higher at Friday debut
Space Exploration Technologies (SPCX), aka SpaceX, zoomed 24% higher soon after the start of its first IPO trading day on Friday. Shares of the rocket and artificial intelligence (AI) company founded by Elon Musk began trading at about 11:46 am EST and quickly gained speed.
4.2% headline, 0.2% core: Why the Fed's next hike may be targeting the wrong problem

May's CPI put headline inflation at 4.2% on the year, up from 3.8% in April and the hottest reading since April 2023, while core prices rose just 0.2% on the month, undershooting the 0.3% consensus and halving April's pace.